Trend Tracker
trope / stable
Figure Cover
All genres · All markets · comparable 30 days periods
+5.3percentage
points
points
01 / Current window
Observed Prevalence
Oct 5n=105Oct 10n=155Oct 15n=157Oct 20n=133Oct 25n=86Oct 30n=32
Empty time buckets are shown as zero and retain their sample size; they are not interpolated by AI.
02 / Market separation
Source Breakdown
03 / Underlying evidence
289 matching Covers.
These are the records counted in the current prevalence numerator.
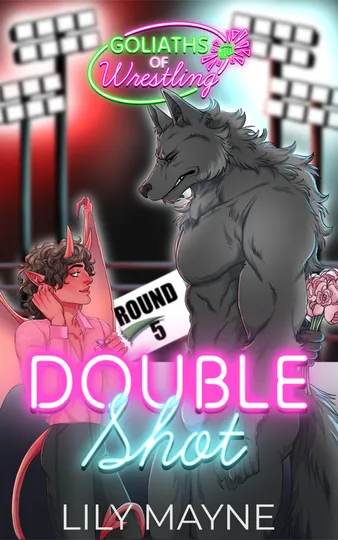 Amazon New Releases
Double Shot (Goliaths of Wrestling Book 5)
Lily Mayne
Inspect evidence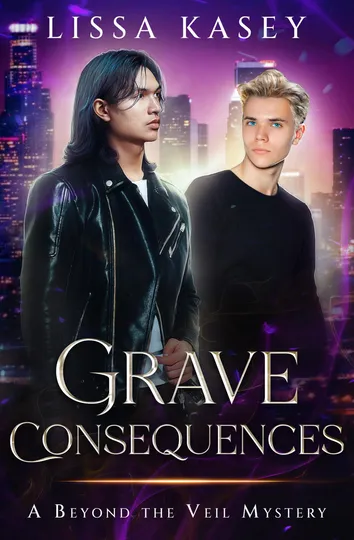 Amazon New Releases
Grave Consequences: A Beyond the Veil Mystery (Gay Paranormal Romantic Mystery)
Lissa Kasey
Inspect evidence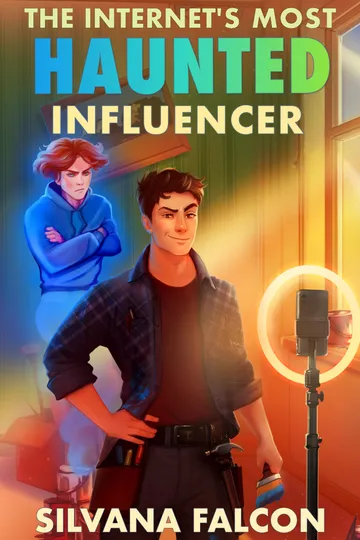 Amazon New Releases
The Internet's Most Haunted Influencer (Supernatural Suckers Book 4)
Silvana Falcon
Inspect evidence Traditional Publishers
Resurrection Kill
Laura Joh Rowland
Inspect evidence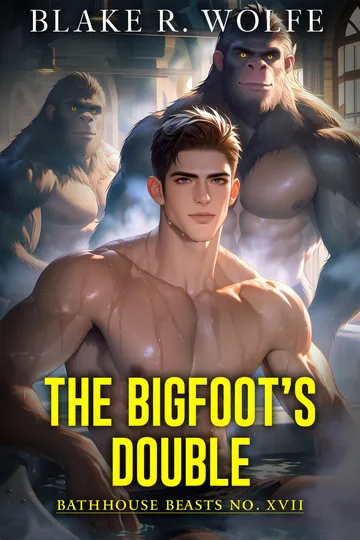 Amazon New Releases
The Bigfoot's Double: A Gay MM Spicy Paranormal Shifter Romance (Bathhouse Beasts Book 17)
Blake R. Wolfe
Inspect evidence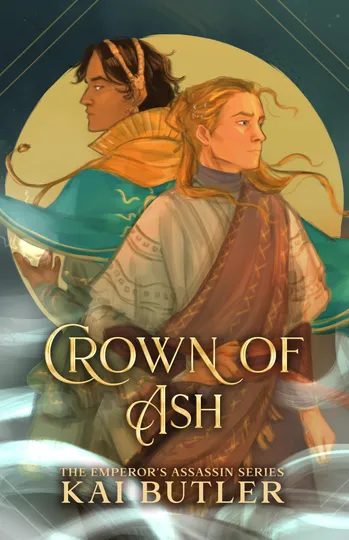 Amazon New Releases
Crown of Ash (Emperor's Assassin Book 5)
Kai Butler
Inspect evidence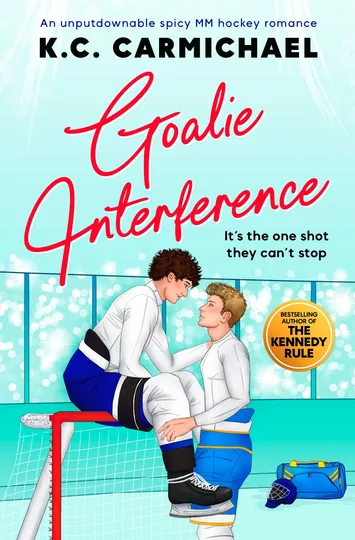 Amazon New Releases
Goalie Interference: An unputdownable spicy MM hockey romance (On Thin Ice Book 3)
K.C. Carmichael
Inspect evidence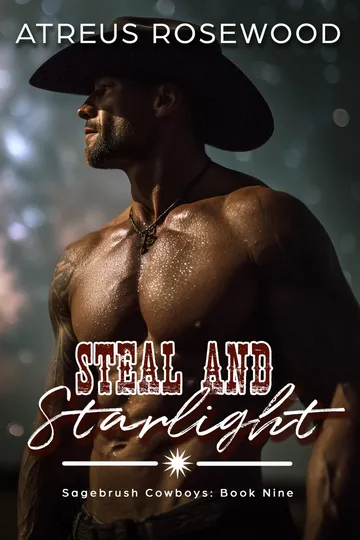 Amazon New Releases
Steal and Starlight: A Sweet and Spicy MM Cowboy Romance (Sagebrush Cowboys Book 9)
Atreus Rosewood
Inspect evidence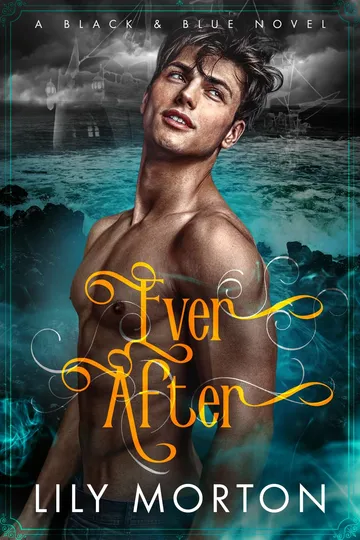 Amazon Bestsellers
Ever After (Black and Blue Series Book 4)
Lily Morton
Inspect evidence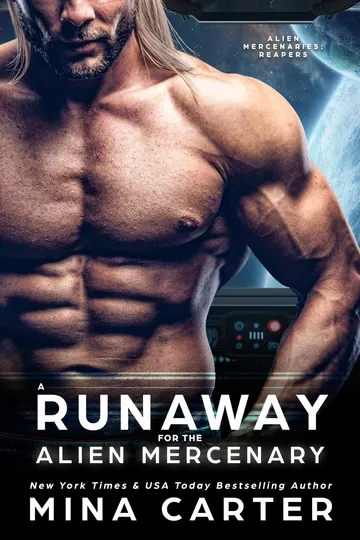 Amazon Bestsellers
A Runaway for the Alien Mercenary (Alien Mercenaries: Reapers Book 3)
Mina Carter
Inspect evidence Amazon New Releases
All We'll Never Have: MMM Vampire Ageplay Romance
Aria Grace
Inspect evidence Amazon New Releases
The Prince from the Painting (Book #5): A Historical Progression Fantasy Series
Boris Romanovsky
Inspect evidence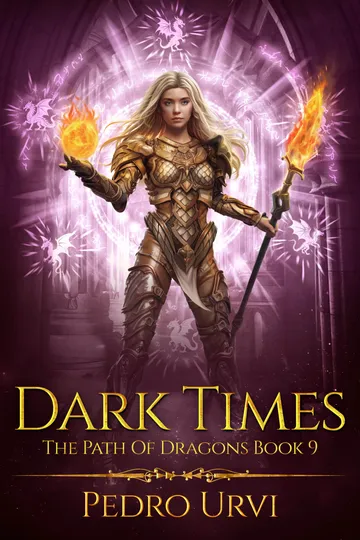 Amazon Bestsellers
Dark Times: (The Path of Dragons, Book 9)
Pedro Urvi
Inspect evidence Amazon New Releases
Man Advantage: A Teammates to Lovers Gay Hockey Romance (Lakeshore Stags)
Quinn Ward
Inspect evidence Amazon Bestsellers
House of Peril: A Bow Street Duchess Mystery (Bow Street Duchess Mystery Series Book 8)
Cara Devlin
Inspect evidence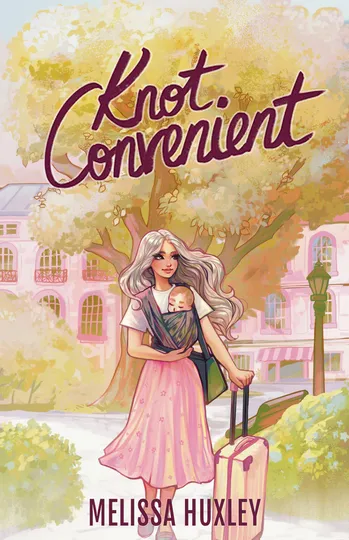 Amazon Bestsellers
Knot Convenient (Willow Grove Book 1)
Melissa Huxley
Inspect evidence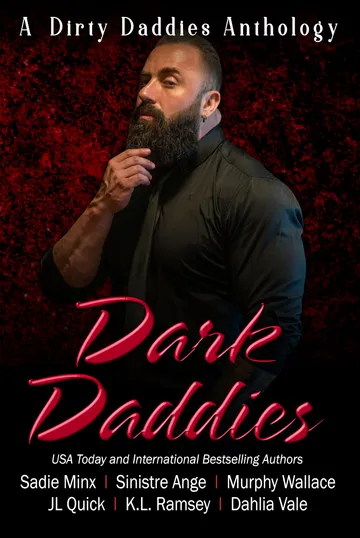 Amazon Bestsellers
Dark Daddies (Dirty Daddies Anthologies Book 8)
Sadie Minx
Inspect evidence Amazon New Releases
The Body at Waterloo Station: An unputdownable historical murder mystery (A Emma Langley Victorian Mystery Book 6)
Emily Organ
Inspect evidence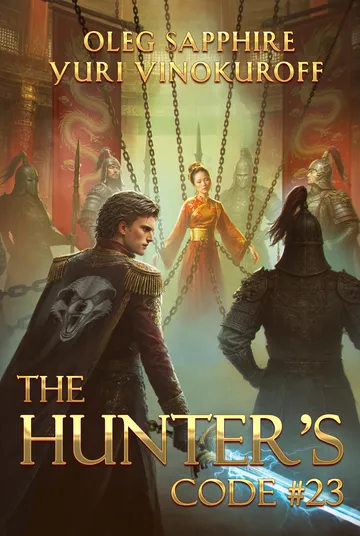 Amazon New Releases
The Hunter’s Code: Book 23: A Portal Progression Fantasy Series
Yuri Vinokuroff
Inspect evidence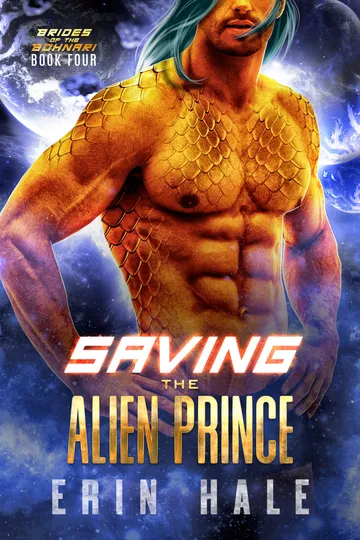 Amazon New Releases
Saving the Alien Prince (Brides of the Bohnari Book 4)
Erin Hale
Inspect evidence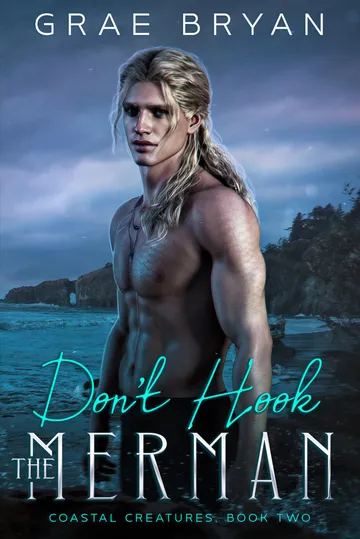 Amazon Bestsellers
Don't Hook the Merman (Coastal Creatures Book 2)
Grae Bryan
Inspect evidence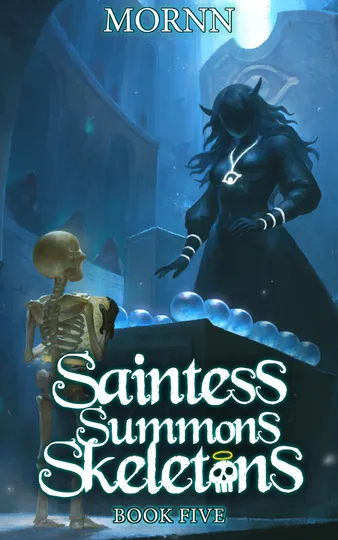 Amazon Bestsellers
Saintess Summons Skeletons 5: A Holy Necromancy LitRPG
Mornn
Inspect evidence Amazon Bestsellers
Who the Heart Chooses: A Marriage of Convenience, Friends to Strangers to Lovers Romance: Garnet Valley Book 1 (Garnet Valley Series)
Harlow James
Inspect evidence Amazon New Releases
Hollow Knife: A Dark MM Romance (The Void Kings)
Melysia M
Inspect evidence Amazon New Releases
You Come, You Lose: Straight to Gay MM First Time (Straight College Jocks)
Lucas Blaze
Inspect evidence Amazon New Releases
Into the Fire: Badlands, Book 8
Morgan Brice
Inspect evidence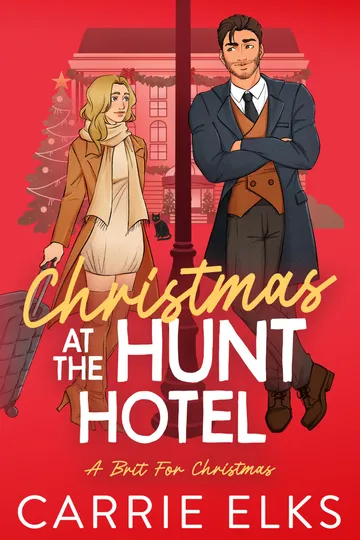 Amazon New Releases
Christmas At The Hunt Hotel
Carrie Elks
Inspect evidence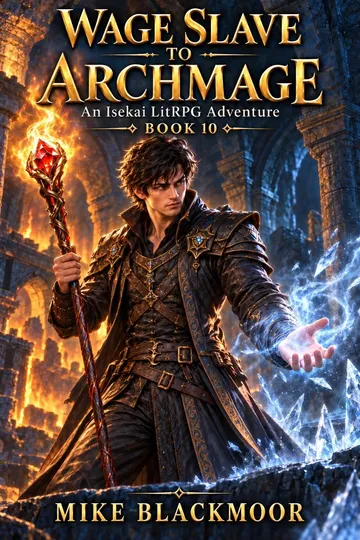 Amazon New Releases
Wage Slave to Archmage:An Isekai LitRPG Adventure (BOOK 10) (Wage Slave to Archmage: An Isekai LitRPG Adventure)
Mike Blackmoor
Inspect evidence Amazon Bestsellers
Epidermis
Asa Violet
Inspect evidence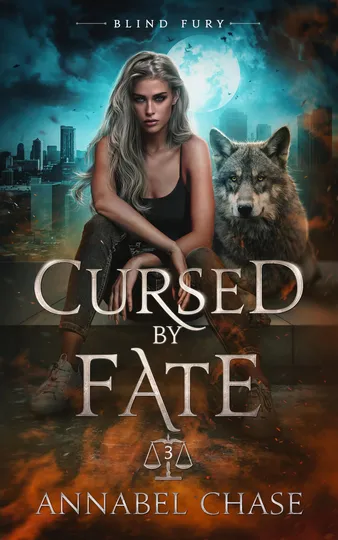 Amazon Bestsellers
Cursed By Fate (Blind Fury Book 3)
Annabel Chase
Inspect evidence Traditional Publishers
The Underground Bakery: Completely gripping and heart-wrenching World War 2 historical fiction
Gosia Nealon
Inspect evidence Amazon Bestsellers
Reckless Obsession
Vee Eddy
Inspect evidence Amazon Bestsellers
The Forbidden One (The Weston Group Book 5)
Marni Mann
Inspect evidence Amazon New Releases
Claiming Axel: Pittsburgh Vampires Vol. 32
B.A. Stretke
Inspect evidence Amazon Bestsellers
Breakaway Bet (The Bradley Legacy Book 7)
Lisa Suzanne
Inspect evidence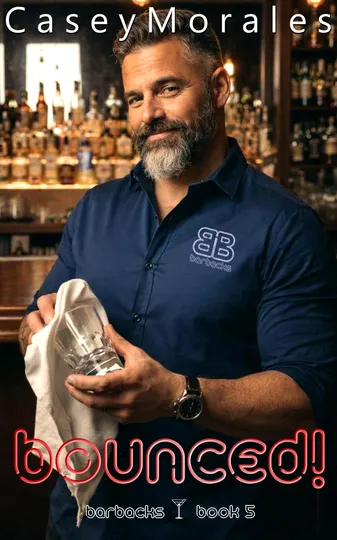 Amazon New Releases
Bounced!: A fun, heartwarming mm contemporary romance (Barbacks Book 5)
Casey Morales
Inspect evidence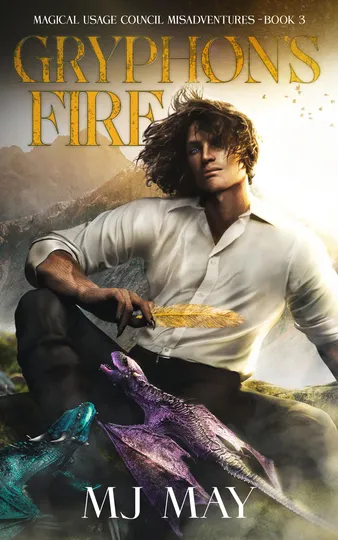 Amazon New Releases
Gryphon's Fire: Magical Usage Council Misadventures Book 3
MJ May
Inspect evidence Amazon New Releases
The Billionaire's Milky Nanny: An age gap instalove lactation romance (Milk For The Billionaire)
Willow Watkins
Inspect evidence Amazon Bestsellers
Return of the Strongest Archmage Who Retired to Become an Adventurer Book Two: An OP MC Cozy Slice of Life LitRPG Adventure
Trio Stars
Inspect evidence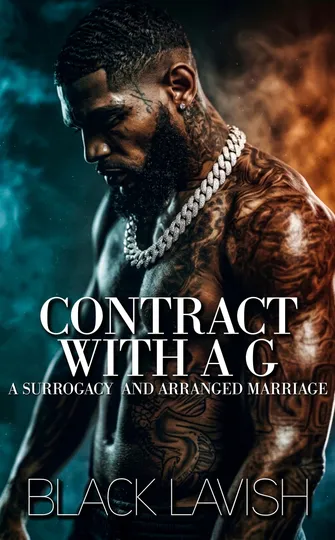 Amazon New Releases
Contract With A G: A Surrogacy And Arranged Marriage
Black Lavish
Inspect evidence Amazon Bestsellers
Through Uncharted Space (Phoenix Adventures Book 9)
Anna Hackett
Inspect evidence Amazon New Releases
Eight Tricks for Mind Blowing Telepathy: A Sci-fi Alien Girl Harem Adventure (Space Prison Book 4)
J Foster Ward
Inspect evidence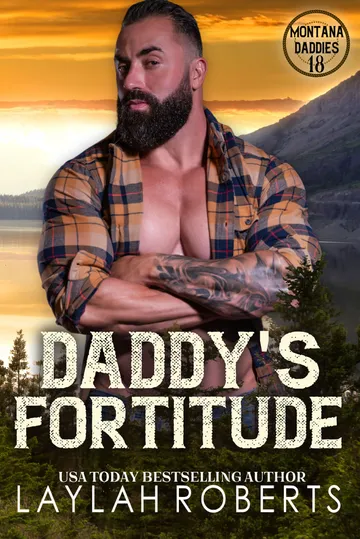 Amazon New Releases
Daddy's Fortitude (Montana Daddies Book 18)
Laylah Roberts
Inspect evidence Amazon Bestsellers
My Doctor Husband Neglected Me, Ignored Our Baby for Another Woman: A 4-Book Collection of Billionaire, Marriage-in-Crisis, Second-Chance Romances (Billionaire Marriage in Crisis 58)
CM Maya
Inspect evidence Amazon New Releases
Born Null: My Twin's Every Breakthrough Makes Me Ten Times Stronger: An OP MC Cozy Slice of Life LitRPG Adventure
Trio Stars
Inspect evidence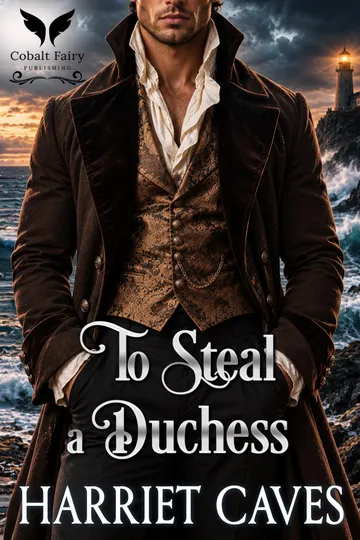 Amazon New Releases
To Steal a Duchess: A Historical Regency Romance Novel (Stolen by the Duke Book 14)
Harriet Caves
Inspect evidence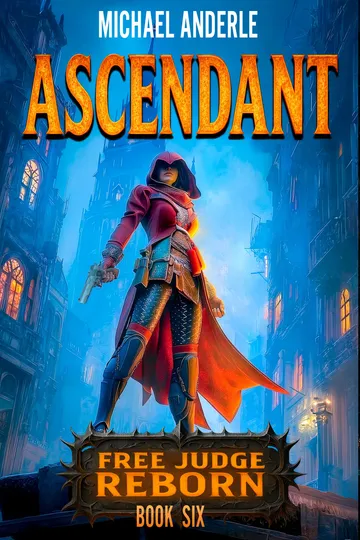 Amazon Bestsellers
Ascendant (Free Judge Reborn Book 6)
Michael Anderle
Inspect evidence Amazon New Releases
Every November
Bec Benson
Inspect evidence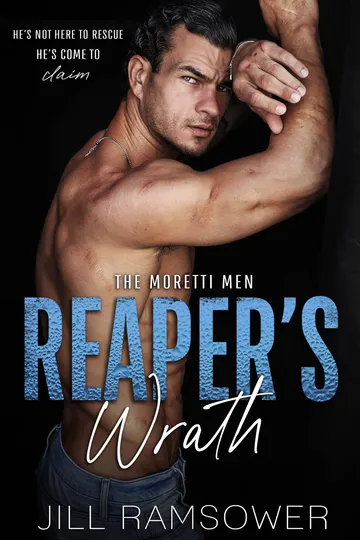 Amazon Bestsellers
Reaper's Wrath: A Secret Twin Mafia Captive Romance (The Moretti Men)
Jill Ramsower
Inspect evidence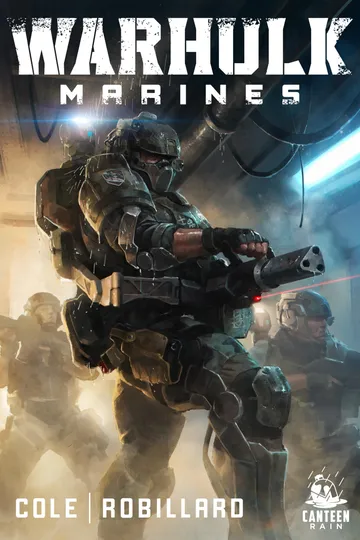 Amazon New Releases
WarHulk Marines: Space Marine Survival
Nick Cole
Inspect evidence Amazon Bestsellers
Undone: A Novel (The Undone Book 4)
Peyton Corinne
Inspect evidence Amazon Bestsellers
Babygirl
Lucy Lennox
Inspect evidence Amazon Bestsellers
The Christmas Clause: the BRAND NEW hot and steamy, magic infused, festive romance
Sharon Ibbotson
Inspect evidence Amazon New Releases
Crash Course (Ashford Academy)
Piper Lawson
Inspect evidence Amazon Bestsellers
Halloween In The Trenches: A Hood Haunting Romance
Vee Bryant
Inspect evidence Amazon Bestsellers
A Married Little Christmas
Abby Jimenez
Inspect evidence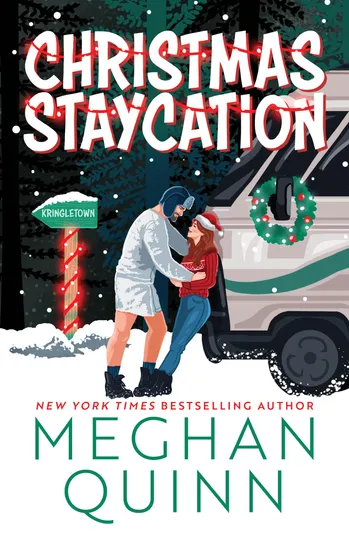 Amazon Bestsellers
Christmas Staycation
Meghan Quinn
Inspect evidence Amazon New Releases
The Array
J.J. Trent
Inspect evidence Traditional Publishers
The Diary at the Irish Adoption House: A completely heartbreaking and addictive Irish historical fiction novel
Michelle Vernal
Inspect evidence Amazon Bestsellers
Star Map (Star Map Book One)
Nathan Hystad
Inspect evidence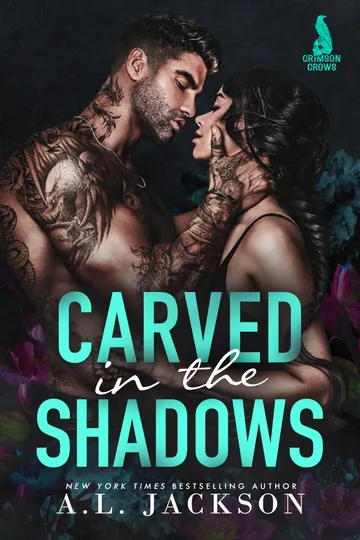 Amazon Bestsellers
Carved in the Shadows: A Brother's Best Friend Dark Small Town Romantic Suspense (Crimson Crows Book 2)
A.L. Jackson
Inspect evidence Amazon Bestsellers
I Accidentally Joined a Wolf Shifter Group Chat
Roxie Ray
Inspect evidence Amazon New Releases
Unchained by the Beastly Duke: A Steamy Historical Regency Romance Novel (Dukes of Dominance Book 5)
Scarlett Osborne
Inspect evidence Amazon Bestsellers
The Beekeeper: A Friends to Lovers Single Dad Romance (The Kinkades Book 6)
Dr. Rebecca Sharp
Inspect evidence Amazon New Releases
Land of Ghosts
E L James
Inspect evidence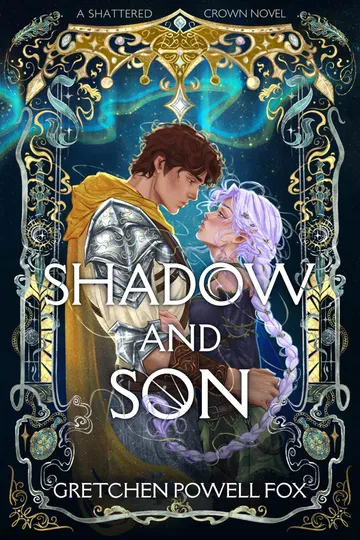 Amazon New Releases
Shadow and Son (Shattered Crown Book 3)
Gretchen Powell Fox
Inspect evidence Amazon New Releases
Lethal Kiss
Taylor Grothe
Inspect evidence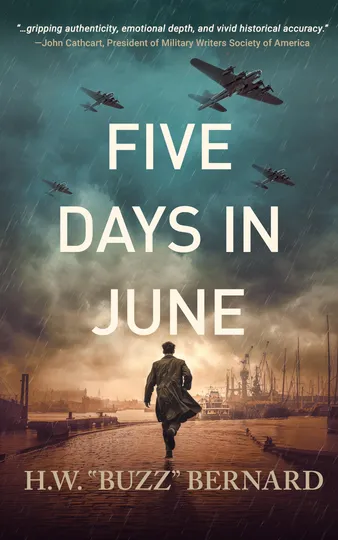 Amazon New Releases
Five Days in June (When Heroes Flew Book 7)
H.W. "Buzz" Bernard
Inspect evidence Amazon New Releases
A MISTLETOE KISS
Eloisa James
Inspect evidence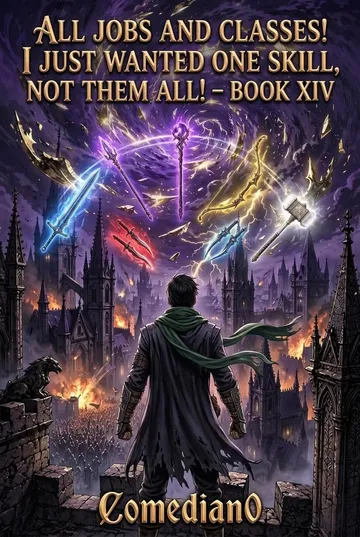 Amazon New Releases
All Jobs and Classes! I Just Wanted One Skill, Not Them All! (LITRPG/EPIC PROGRESSION): Book XIV
Comedian0 L
Inspect evidence Amazon Bestsellers
My Cowboy Husband Neglected Me, Left Our Baby for Another Woman’s: A 4-Book Collection of Billionaire, Marriage-in-Crisis, Second-Chance Romances (marriage in crisis: season 2)
Lira Rain
Inspect evidence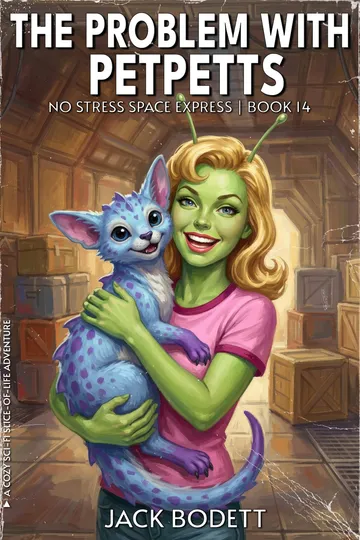 Amazon New Releases
The Problem with Petpetts: A Cozy, Low-Stakes, Slice-of-Life Sci-fi Adventure (No Stress Space Express Book 14)
Jack Bodett
Inspect evidence Amazon Bestsellers
Hidden from the Bratva: A BWWM Secret Twins Mafia Romance (Bratva Bloodlines Book 2)
Destiny Davis
Inspect evidence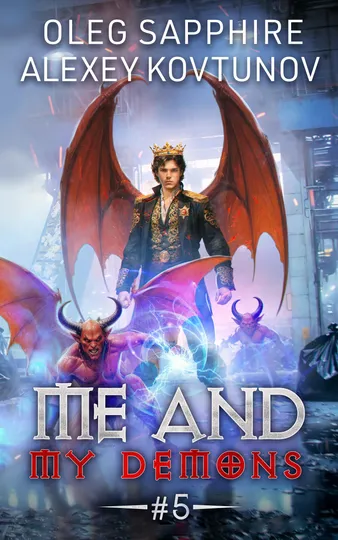 Amazon New Releases
Me and My Demons (Book 5): A Portal Progression Adventure Fantasy Series
Oleg Sapphire
Inspect evidence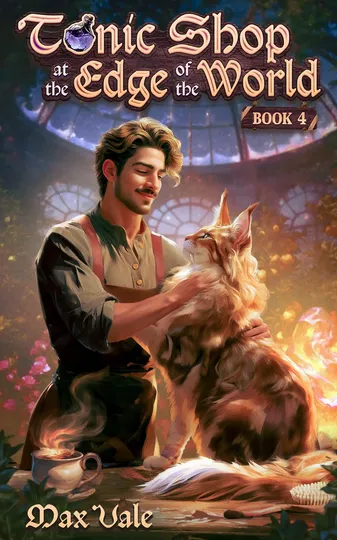 Amazon New Releases
Tonic Shop at the Edge of the World 4: A Cozy LitRPG
Max Vale
Inspect evidence Amazon Bestsellers
Lady Gray (House of Gray Book 9)
Isabel Campbell
Inspect evidence Amazon Bestsellers
Holly & Folly: a Christmas Regency romance (Belles of Christmas: House Party)
Martha Keyes
Inspect evidence Amazon New Releases
The Anguished Earth: An Empire of the Wolf Novella
Richard Swan
Inspect evidence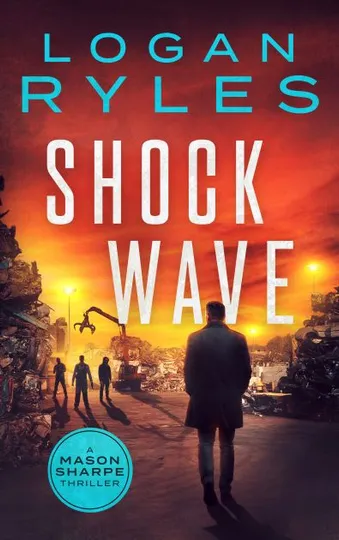 Amazon Bestsellers
Shock Wave (Mason Sharpe Thrillers Book 15)
Logan Ryles
Inspect evidence Amazon New Releases
The Healer’s Way (Book 19): A Portal Progression Fantasy Series (The Healer's Way)
Oleg Sapphire
Inspect evidence Amazon Bestsellers
Un placer, milord (Spanish Edition)
Sophie Saint Rose
Inspect evidence Amazon New Releases
The Dragon's Temporary Manny: An MM Mpreg Shifter Romance (Paranormal Au Pair Agency)
Colbie Dunbar
Inspect evidence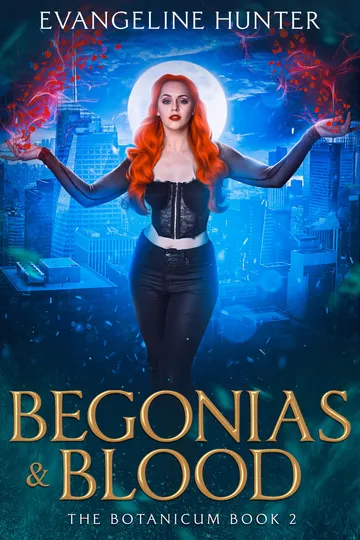 Amazon Bestsellers
Begonias and Blood: Fast-paced Humorous Urban Fantasy (The Botanicum Book 2)
Evangeline Hunter
Inspect evidence Amazon New Releases
Vyatkin (Chronicles of the Fall Book 27)
Pam Uphoff
Inspect evidence Amazon New Releases
The Duke's Christmas Cinderella: A Historical Regency Romance Novel (Mistletoe and Manners Book 8)
Amanda Stones
Inspect evidence Amazon New Releases
Milky for the Man of the House: A Sleep-Play Age Gap Pregnancy Romance with Lactation (Sleep Play Fantasies Book 2)
Krystal Clark
Inspect evidence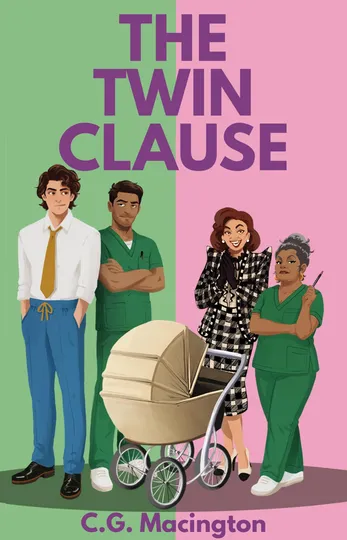 Amazon Bestsellers
The Twin Clause (The St. Jude's Medical Series Book 4)
C.G. Macington
Inspect evidence Amazon Bestsellers
Her Wedding to the Highland Devil: A Scottish Historical Romance (Lairds' Portraits Book 2)
Lydia Kendall
Inspect evidence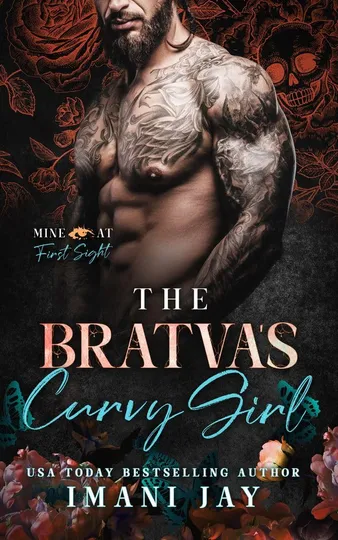 Amazon New Releases
The Bratva's Curvy Girl: Mine At First Sight
Imani Jay
Inspect evidence Amazon Bestsellers
Having A Baby Girl By A Wealthy Hood Bully : Episode One
Shantelly
Inspect evidence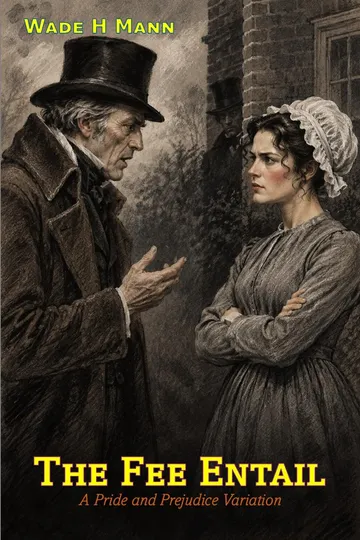 Amazon New Releases
The Fee Entail: A Pride and Prejudice Variation (Pride and Prejudice Variations)
Wade H Mann
Inspect evidence Amazon Bestsellers
Anna and the Mad Earl (Wishing Well Seminary)
Sofi Laporte
Inspect evidence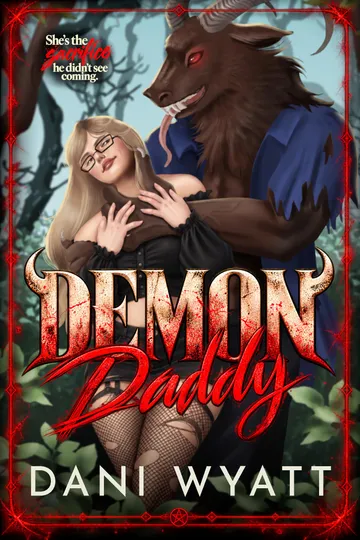 Amazon Bestsellers
DEMON DADDY: A Monster Daddy Spicy Size Difference Curvy Girl Romance
Dani Wyatt
Inspect evidence Amazon Bestsellers
Game Plan: Fake Fiancée / Friends to Lovers Romance
Adriana Locke
Inspect evidence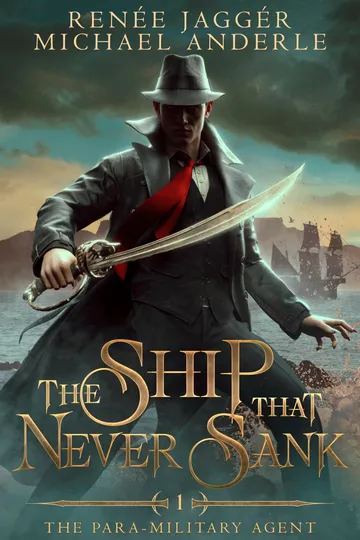 Amazon Bestsellers
The Ship that Never Sank (The Para-Military Agent Book 1)
Renée Jaggér
Inspect evidence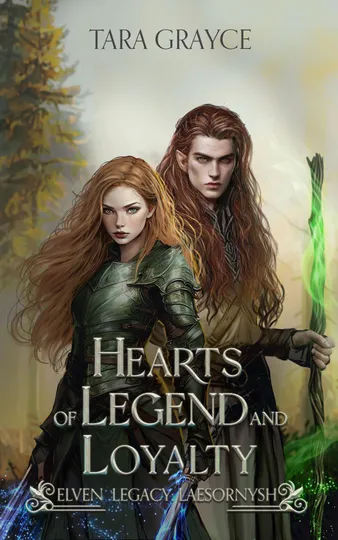 Amazon Bestsellers
Hearts of Legend and Loyalty: Elven Legacy: Laesornysh
Tara Grayce
Inspect evidence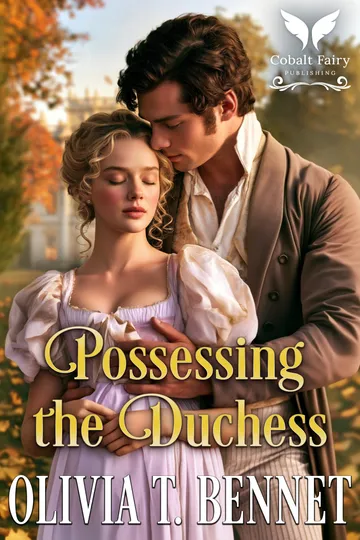 Amazon New Releases
Possessing the Duchess: A Historical Regency Romance Novel (The Ruined Duchesses Book 1)
Olivia T. Bennet
Inspect evidence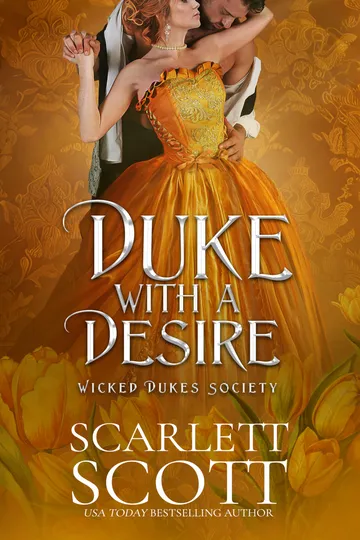 Amazon Bestsellers
Duke with a Desire (Wicked Dukes Society Book 7)
Scarlett Scott
Inspect evidence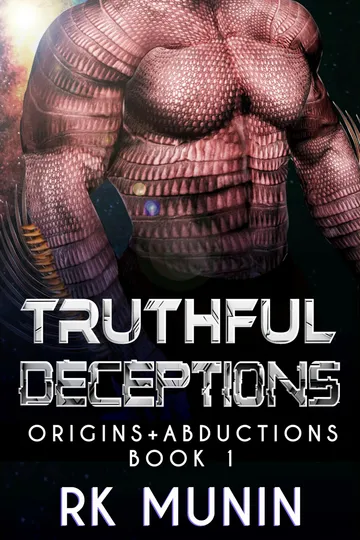 Amazon New Releases
Truthful Deceptions: MF, Sci-fi, Alien romance (Origins + Abduction Book 1)
RK Munin
Inspect evidence Amazon Bestsellers
The Widower's Secret Trail Bride: A Historical Western Romance Novel (Whispers of the Western Wind)
Lorelei Brogan
Inspect evidence Amazon Bestsellers
Offside Rules: A hockey romance book (Rookie Hawkeyes Series 7)
Kenna King
Inspect evidence Amazon Bestsellers
One Moore Time
Mariana Zapata
Inspect evidence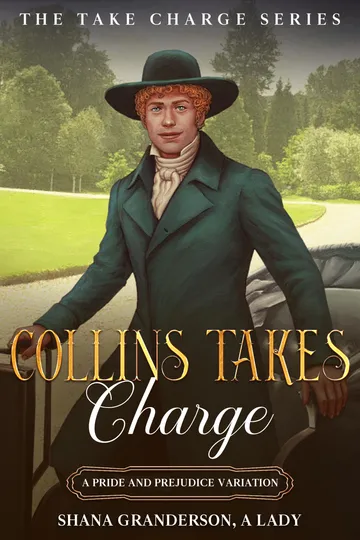 Amazon Bestsellers
Collins Takes Charge: A Pride & Prejudice Variation (Take Charge Series)
Shana Granderson A Lady
Inspect evidence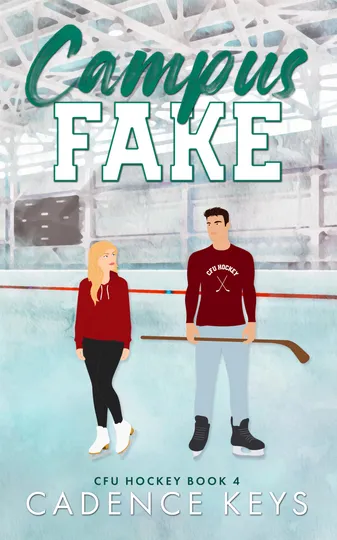 Amazon Bestsellers
Campus Fake: A Steamy Hockey Romance (CFU Hockey Book 4)
Cadence Keys
Inspect evidence Amazon New Releases
The Dark Mage 4: An OP MC PROG FANTASY
RealKaiden
Inspect evidence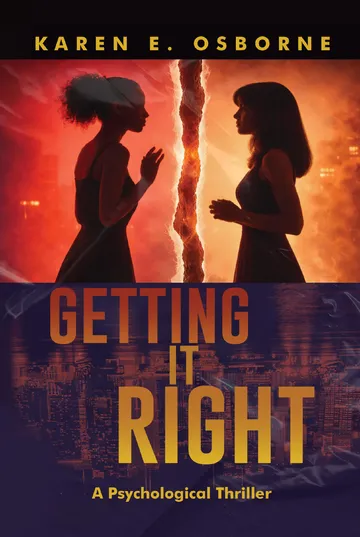 Amazon Bestsellers
Getting it Right: A Psychological Thriller
Karen E. Osborne
Inspect evidence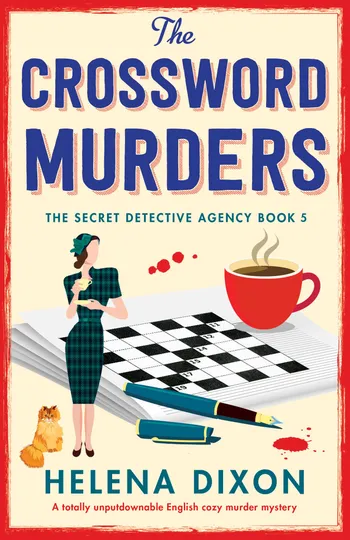 Amazon Bestsellers
The Crossword Murders: A totally unputdownable English cozy murder mystery (The Secret Detective Agency Book 5)
Helena Dixon
Inspect evidence Amazon New Releases
Pregnant: A Pregnant Lactation Erotica (Free Use Hucow 4)
Evelyn Wild
Inspect evidence Amazon New Releases
Obsession: Part One
Nick Storming
Inspect evidence Amazon New Releases
Captain’s Orders: A Dominant Older Firefighter and His Innocent Virgin (Forbidden Firsts)
Felicity Blaze
Inspect evidence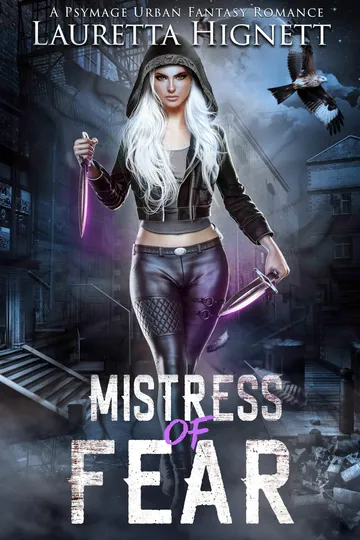 Amazon Bestsellers
Mistress of Fear: A Psymage Urban Fantasy Romance (A Legacy of Vengeance and Magic Book 1)
Lauretta Hignett
Inspect evidence Amazon Bestsellers
Chasing Smoke (The Mercer Family Book 2)
Piper Rayne
Inspect evidence Amazon New Releases
Tasted By The Lynx Stepbrother: A Monster Erotica Short (Yellow World Monster Stepbrothers)
Zoe Krave
Inspect evidence Amazon Bestsellers
Werewolf Single Dad 7
Logan Jacobs
Inspect evidence Amazon Bestsellers
Brighter Than the Stars
Elizabeth O'Roark
Inspect evidence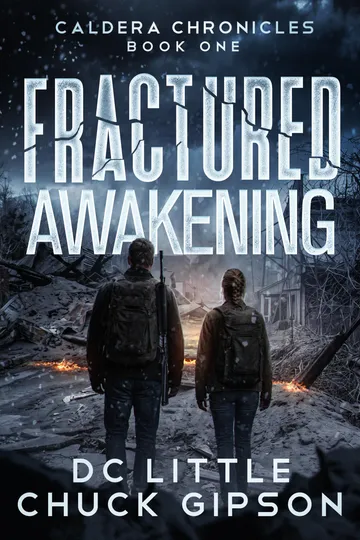 Amazon New Releases
Fractured Awakening: A Post-Apocalyptic Survival Thriller (Caldera Chronicles Book 1)
D. C. Little
Inspect evidence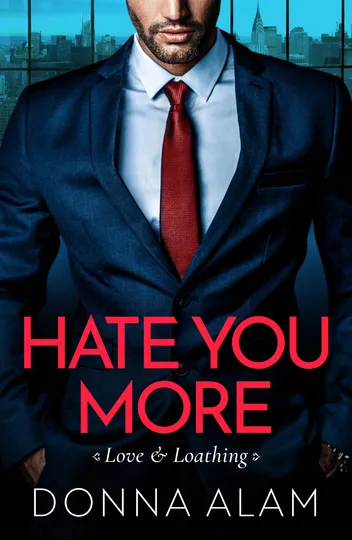 Amazon Bestsellers
Hate You More (Love & Loathing Book 1)
Donna Alam
Inspect evidence Amazon Bestsellers
Jalon (Van Doren Book 5)
Crea Reitan
Inspect evidence Amazon New Releases
The Duke’s Godsend Bride: A Historical Regency Romance Novel (The Brooding Dukes Book 6)
Tiffany Baton
Inspect evidence Traditional Publishers
Blood Money: An explosive gangland thriller (The Anderson Family Trilogy Book 3)
Maya Ross
Inspect evidence Amazon Bestsellers
The Feeder Legacy (The Vampire Dominion Book 1)
Louisa Masters
Inspect evidence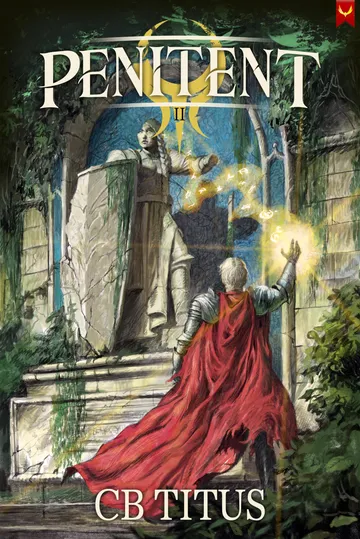 Amazon New Releases
Penitent 2: A LitRPG Progression Epic
C.B. Titus
Inspect evidence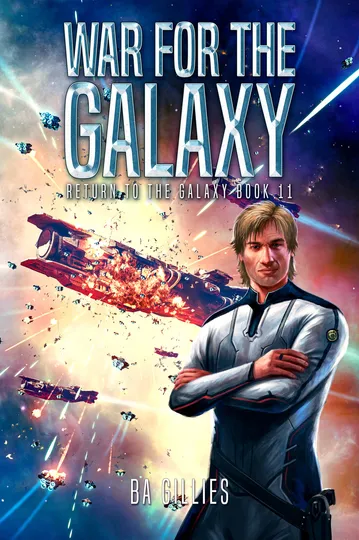 Amazon New Releases
War For The Galaxy: A Space Opera of Alien Invasion and Human Resistance (Return To The Galaxy Book 11)
BA Gillies
Inspect evidence Amazon New Releases
Born For The Fight
Brent Johnston
Inspect evidence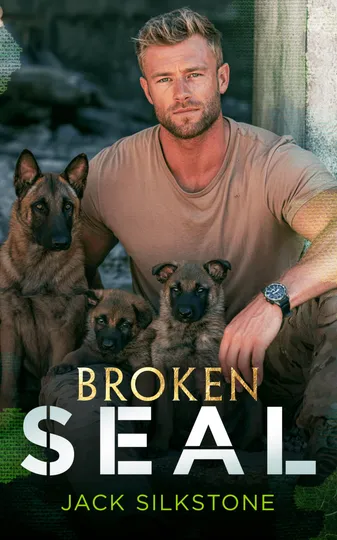 Amazon New Releases
Broken SEAL: A Light-Hearted Military K9 Romance of Brotherhood, Betrayal and Stolen Puppies
Jack Silkstone
Inspect evidence Amazon Bestsellers
The Millionaire Playing As My Boyfriend (The Fake Boyfriend Series Book 1)
Monique Chanae
Inspect evidence Amazon New Releases
Shadow Lord: MM Sunshine and Shadow Monster Romance (Shadowmen Book 3)
S. Rodman
Inspect evidence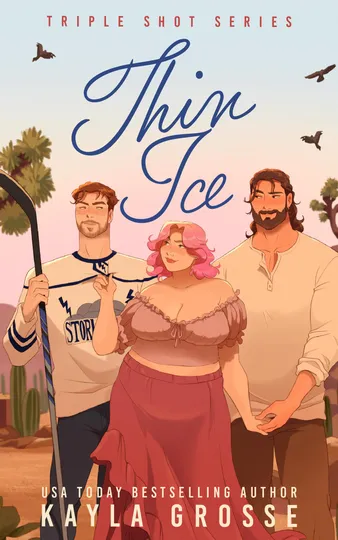 Amazon New Releases
Thin Ice (Triple Shot Book 1)
Kayla Grosse
Inspect evidence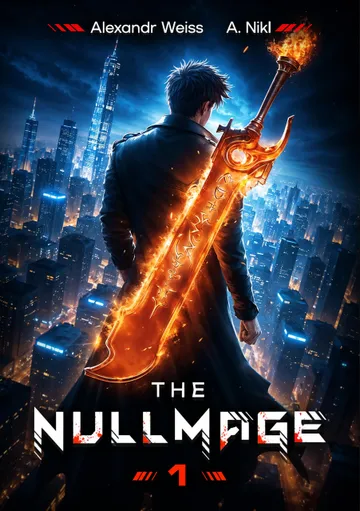 Amazon New Releases
The Nullmage (Book 1): A System Apocalypse Progression Fantasy
A. Nikl
Inspect evidence Amazon New Releases
Fixing Sacred Spells Is Heresy, So I Opened a Repair Shop: An OP MC Cozy Slice of Life LitRPG Adventure
Trio Stars
Inspect evidence Amazon Bestsellers
The Widowmaker's Reluctant Bride: A Historical Western Romance Novel
Sadie Thornwell
Inspect evidence Amazon New Releases
The Duke who Chose her: A Steamy Historical Regency Romance Novel (Regency Daddies Book 2)
Maybel Bardot
Inspect evidence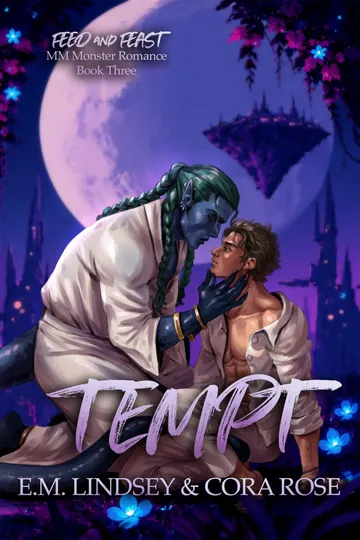 Amazon Bestsellers
Tempt: An MM Monster Romance (Feed and Feast Book 3)
Cora Rose
Inspect evidence Amazon New Releases
The Duke Who Banned Christmas: A Historical Regency Romance Novel (Mistletoe and Manners Book 7)
Sally Forbes
Inspect evidence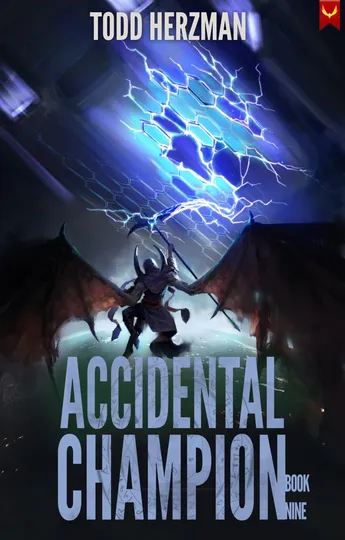 Amazon New Releases
Accidental Champion 9: A LitRPG Adventure
Todd Herzman
Inspect evidence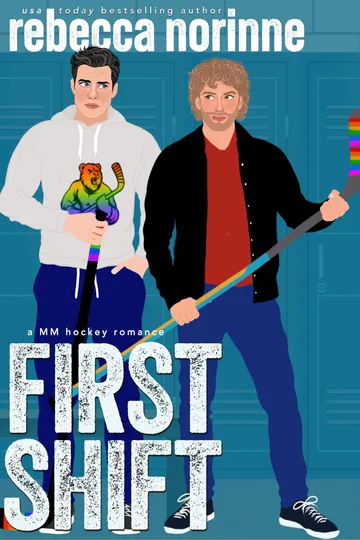 Amazon New Releases
First Shift: A Teammates to Lovers MM Hockey Romance (Maine Marauders Hockey Series Book 3)
Rebecca Norinne
Inspect evidence Amazon Bestsellers
Nobody Warned Me Virtual Pets Could Summon Demons
Lindsey Devin
Inspect evidence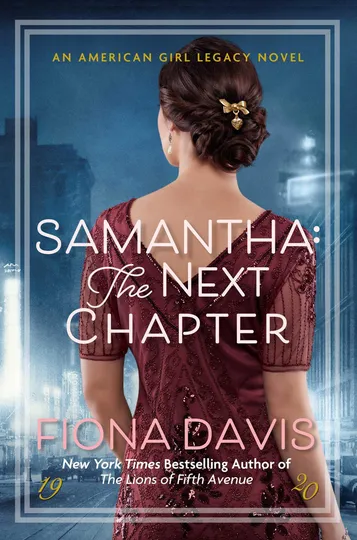 Amazon New Releases
Samantha: The Next Chapter
Fiona Davis
Inspect evidence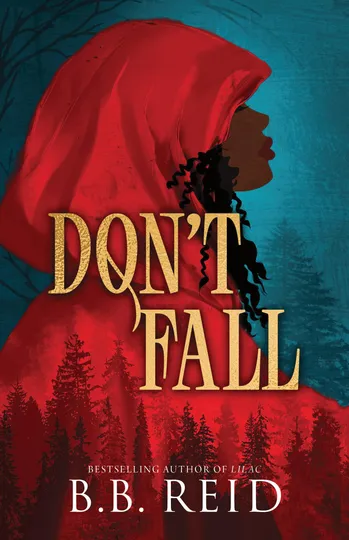 Amazon Bestsellers
Don't Fall (Hunt the Red Hood Book 1)
B.B. Reid
Inspect evidence Amazon Bestsellers
The Brooding Duke’s Unwanted Bride: A Historical Regency Romance Novel (Of Dukes, Dares, and Destinies)
Penelope Whitmore
Inspect evidence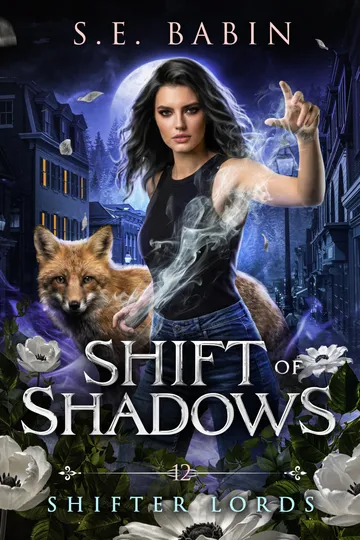 Amazon Bestsellers
Shift of Shadows (Shifter Lords Book 12)
S.E. Babin
Inspect evidence Amazon New Releases
Anchor Point: An Omegaverse Romance (Harbour of Hope Book 2)
Hannah Cowan
Inspect evidence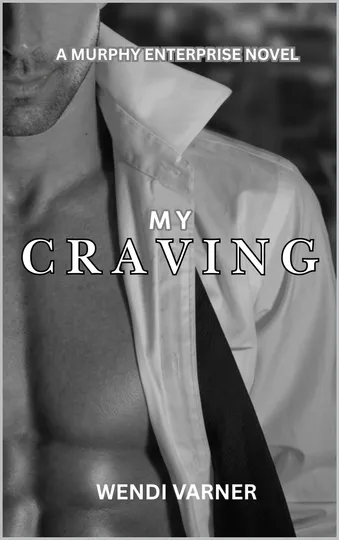 Amazon New Releases
My Craving: Murphy Enterprises Novel
Wendi Varner
Inspect evidence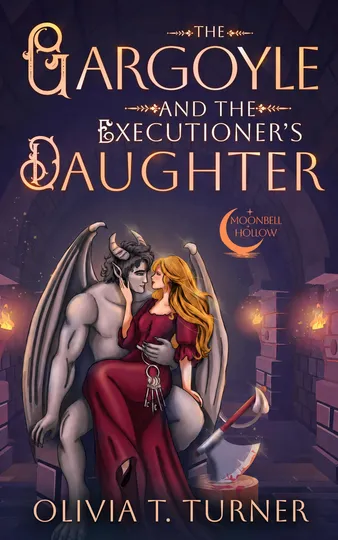 Amazon Bestsellers
The Gargoyle and the Executioner's Daughter (Moonbell Hollow Book 1)
Olivia T. Turner
Inspect evidence Amazon Bestsellers
Pivotal Proof: (Monster Girls in Space Book 9)
M. Tress
Inspect evidence Amazon Bestsellers
Scared Waters (An Enchanted Waters Mystery Book 16)
Jenna St. James
Inspect evidence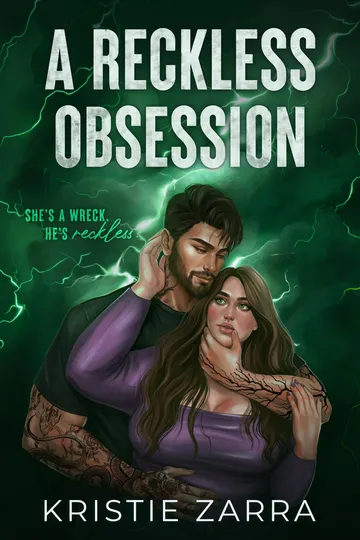 Amazon Bestsellers
A Reckless Obsession (The Reckless Series Book 1)
Kristie Zarra
Inspect evidence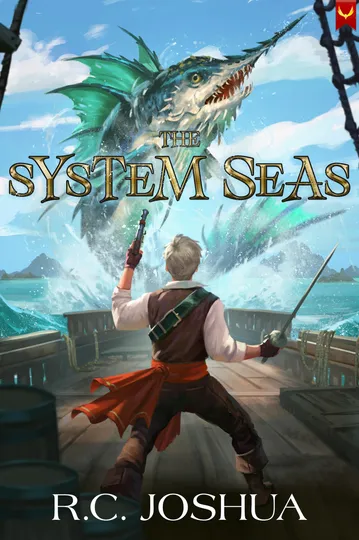 Amazon New Releases
The System Seas: A LitRPG Adventure
R.C. Joshua
Inspect evidence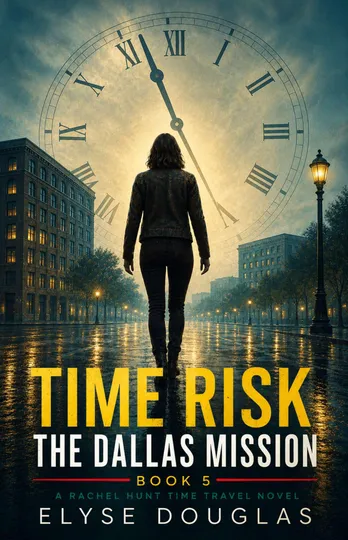 Amazon Bestsellers
Time Risk 5: The Dallas Mission: A Time Travel Mystery and Historical Adventure (Book 5 of the Time Risk Series)
Elyse Douglas
Inspect evidence Amazon Bestsellers
Lavender Hill (The Love Stone)
Aurora Rose Reynolds
Inspect evidence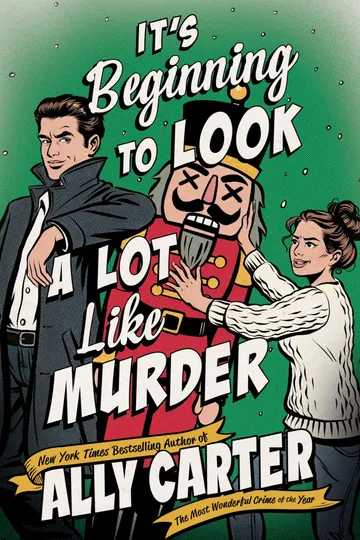 Amazon New Releases
It’s Beginning to Look a Lot Like Murder: A Novel – A Christmas Mystery-Romance of Childhood Enemies-to-Lovers (Kiss Merry Kill Book 2)
Ally Carter
Inspect evidence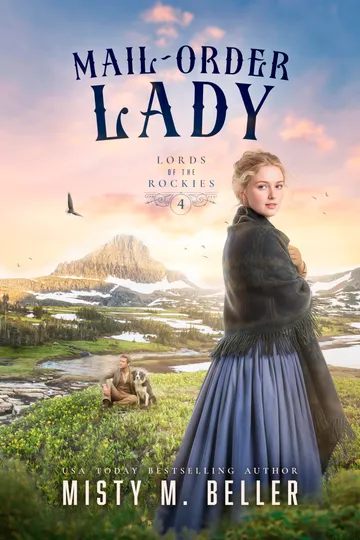 Amazon Bestsellers
Mail-Order Lady (Lords of the Rockies Book 4)
Misty M. Beller
Inspect evidence Amazon Bestsellers
An Irresistible Kiss (Captivating Kisses Book 10)
Alexa Aston
Inspect evidence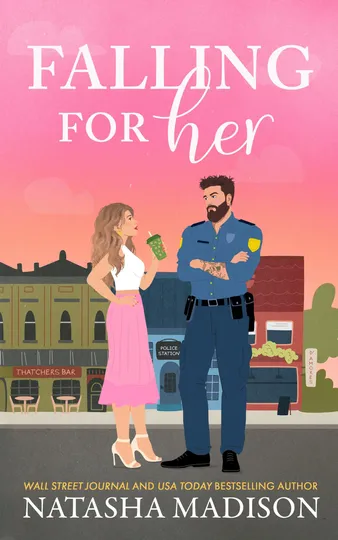 Amazon Bestsellers
Falling for Her (The Falling For Series Book 2)
Natasha Madison
Inspect evidence Amazon New Releases
An Offer by Her Arranged Duke: A Historical Regency Romance Novel (Hidden with the Duke Book 5)
Ava MacAdams
Inspect evidence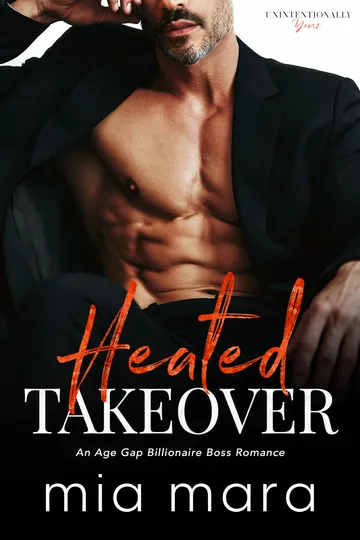 Amazon Bestsellers
Heated Takeover: An Age Gap Billionaire Boss Romance (Unintentionally Yours)
Mia Mara
Inspect evidence Amazon New Releases
Plus One: A Spicy College Harem Romance (Just Friends Book 1)
Rex Sterling
Inspect evidence Amazon New Releases
Shared by My Roommate: An MMM Bi-Awakening College Romance Novella (Off-Limits: Campus Book 1)
Jenny Pineapple
Inspect evidence Amazon New Releases
Too Big for My Step-Niece: Taboo Stretching, Step-Uncle Trains His Tight Step-Niece
MAX ROTICA
Inspect evidence Amazon Bestsellers
A Family Found on the Winter Trail: A Historical Western Romance Novel (Brides of the Untamed Frontier)
Ellen Knightley
Inspect evidence Amazon Bestsellers
The Duke Who Fell for His Brother's Bride: A Historical Regency Romance Novel (Noble Gentlemen of the Ton)
Bridget Barton
Inspect evidence Amazon Bestsellers
The Twelfth Artifact (The Artifact Book 12)
David Collins
Inspect evidence Amazon New Releases
My Husband Neglected Me, Left Me in a Coma, and Chose Another Woman: A 2-Book Collection of Billionaire, Marriage-in-Crisis, Second-Chance Romances (Billionaire Marriage in Crisis 57)
Nola Vero
Inspect evidence Amazon New Releases
Accidental Astronaut 6
J.N. Chaney
Inspect evidence Amazon New Releases
Funhouse: A Supernatural Monster Cuckold Horror Story for Halloween (Screamqueans Book 1)
Molly Pike
Inspect evidence Amazon New Releases
Playing The Game: Two Couples Learn The Rules Of A New Game
Scarlett Duffy
Inspect evidence Amazon Bestsellers
River Dragon's Song (Dragons on Mars Book 3)
Honey Phillips
Inspect evidence Amazon New Releases
I am a Great Druid Who's 400 Years Old (Book #2): A Portal Progression Fantasy Series
Dmitry Dornichev
Inspect evidence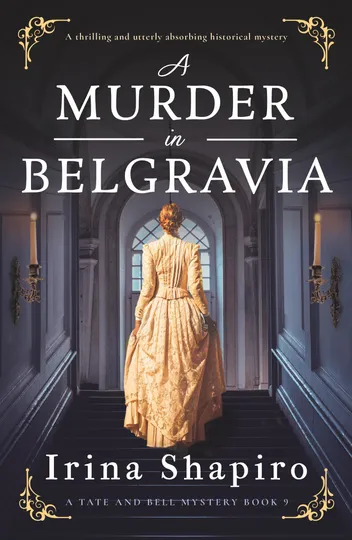 Amazon Bestsellers
A Murder in Belgravia: A thrilling and utterly absorbing historical mystery (A Tate and Bell Mystery Book 9)
Irina Shapiro
Inspect evidence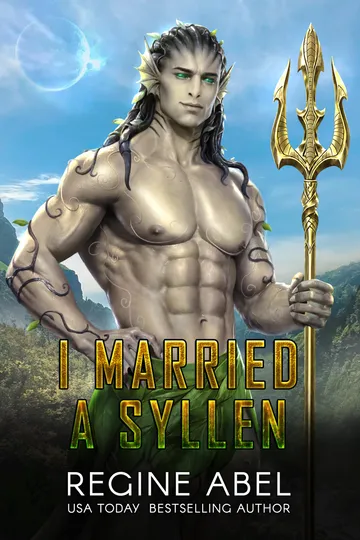 Amazon Bestsellers
I Married A Syllen (Prime Mating Agency)
Regine Abel
Inspect evidence Amazon Bestsellers
The Pakhan’s Unwanted Bride (Sins of the Bratva)
Ariana Cooper
Inspect evidence Amazon Bestsellers
The Duke's Christmas Bargain: A Historical Regency Romance Novel (Mistletoe and Manners Book 6)
Emily Barnet
Inspect evidence Amazon Bestsellers
The Marriage He Abandoned: A Second Chance Romance About a Billionaire's Marriage in Crisis (Groveling Billionaire's Redemption)
Hadley Rush
Inspect evidence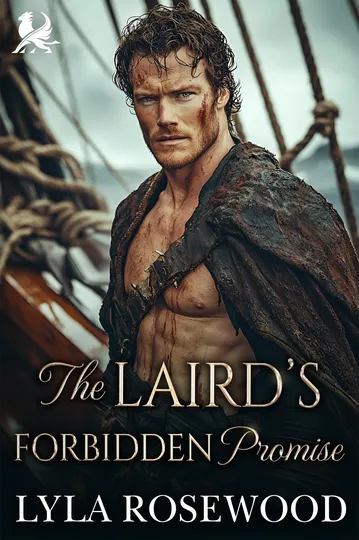 Amazon New Releases
The Laird's Forbidden Promise: Scottish Auction Romance (The Lairds’ Sinful Auctions Book 2)
Lyla Rosewood
Inspect evidence Amazon Bestsellers
Dead America - The Bahamas - Part 5 (Dead America - Tales of the First Month Book 62)
Derek Slaton
Inspect evidence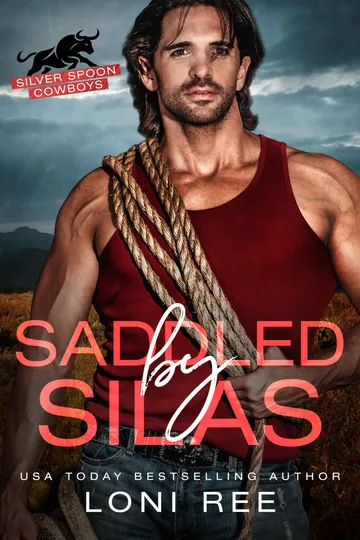 Amazon Bestsellers
Saddled by Silas
Loni Ree
Inspect evidence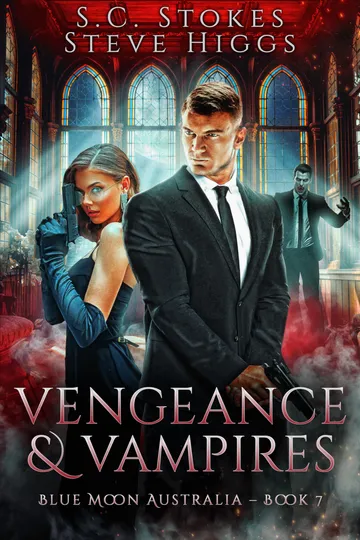 Amazon Bestsellers
Vengeance & Vampires: Blue Moon Australia Book 7
S.C. Stokes
Inspect evidence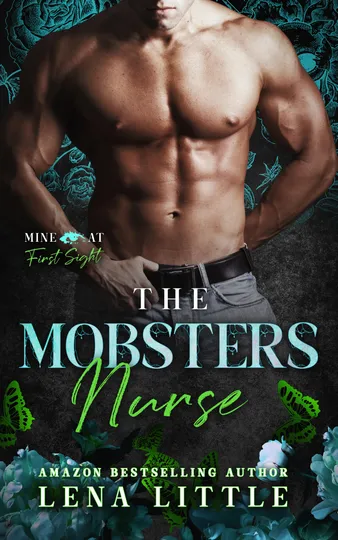 Amazon Bestsellers
The MOBSTER'S NURSE
Lena Little
Inspect evidence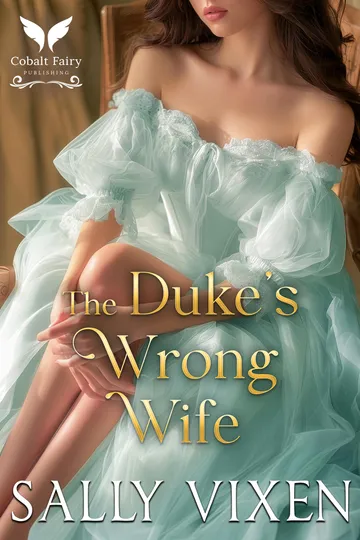 Amazon Bestsellers
The Duke’s Wrong Wife: A Historical Regency Romance Novel (Duchess Deals Book 6)
Sally Vixen
Inspect evidence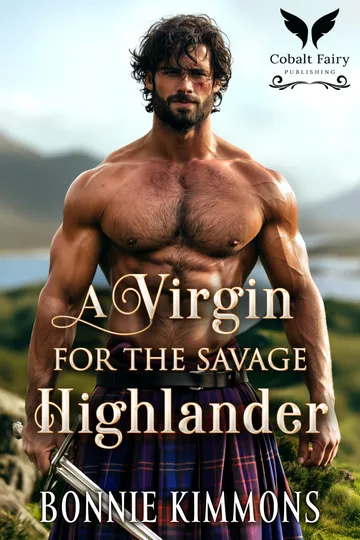 Amazon New Releases
A Virgin for the Savage Highlander: A Scottish Historical Romance Novel (Under the Lairds’ Rule Book 3)
Bonnie Kimmons
Inspect evidence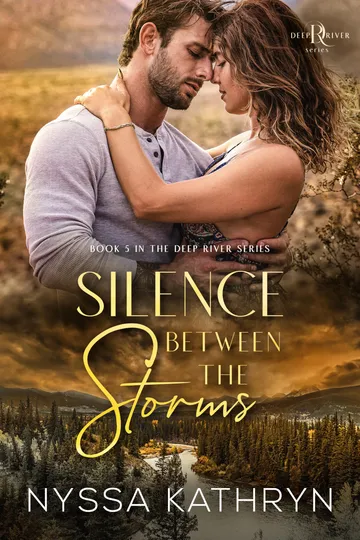 Amazon Bestsellers
Silence Between the Storms: A Small Town, Brother's Best Friend Romantic Suspense (Deep River Book 5)
Nyssa Kathryn
Inspect evidence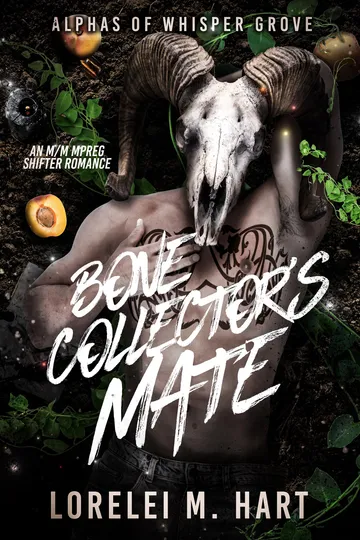 Amazon Bestsellers
Bone Collector's Mate: An M/M Mpreg Shifter Romance (Alphas of Whisper Grove Book 3)
Lorelei M. Hart
Inspect evidence Traditional Publishers
Her Stepmother's House: An absolutely gripping and unputdownable psychological thriller
K.L. Slater
Inspect evidence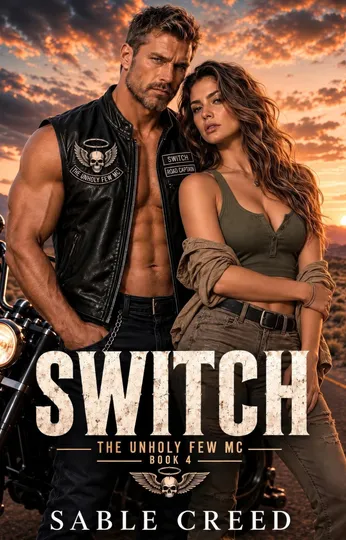 Amazon Bestsellers
Switch (The Unholy Few MC Book 4)
Sable Creed
Inspect evidence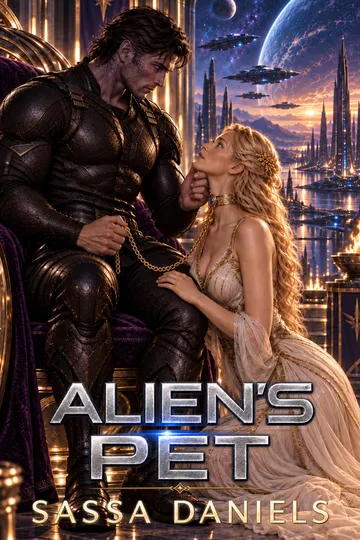 Amazon Bestsellers
Alien's Pet: A Dark Sci-Fi Romance (Conquered Mates Book 3)
Sassa Daniels
Inspect evidence Amazon New Releases
The French Wife: Completely heartbreaking World War 2 fiction
Ann Bennett
Inspect evidence Amazon Bestsellers
My Cowboy Husband Neglected Me and Chose Another Woman's Child Instead of Ours: A Billionaire, Marriage-in-Crisis, Second-Chance Romance (Billionaire Marriage in Crisis Book 56)
CM Maya
Inspect evidence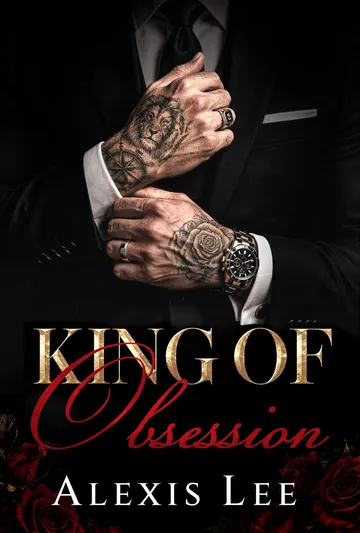 Amazon Bestsellers
King of Obsession: A Forced Marriage Mafia Romance (Wicked Vows)
Alexis Lee
Inspect evidence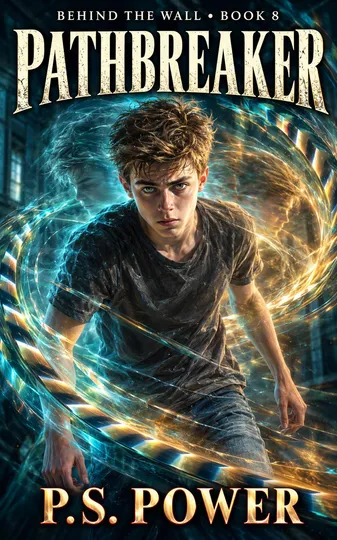 Amazon New Releases
Pathbreaker (Behind the Wall Book 8)
P.S. Power
Inspect evidence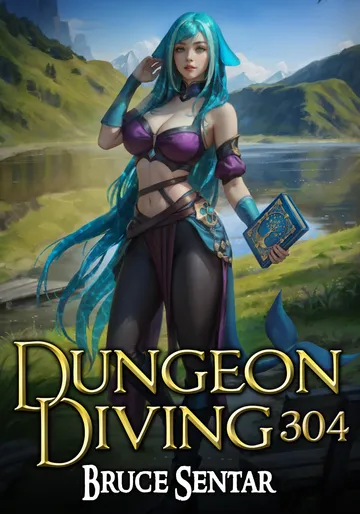 Amazon Bestsellers
Dungeon Diving 304
Bruce Sentar
Inspect evidence Amazon Bestsellers
Shifted Desire: A Forbidden Age Gap Monster Romance (Monsters of Moonvale Book 3)
Emily Antoinette
Inspect evidence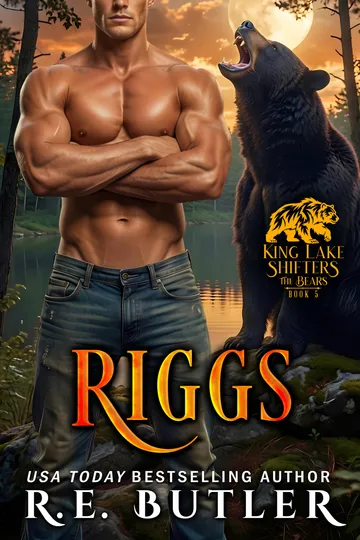 Amazon Bestsellers
Riggs: The Bears (King Lake Shifters Book 5)
R. E. Butler
Inspect evidence Amazon New Releases
Escape the Monster Breeding Grounds Deluxe Edition (Choose Peril or Pleasure 1)
Amanda Clover
Inspect evidence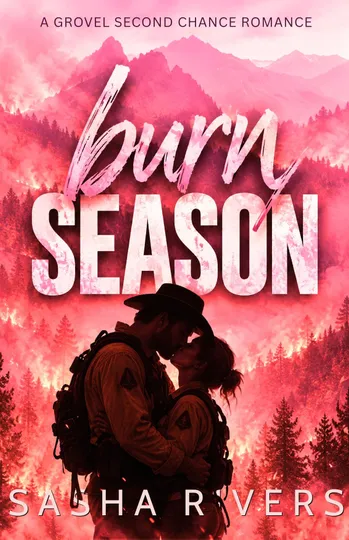 Amazon Bestsellers
Burn Season: A Betrayal, Grovel, Second Chance Romance
Sasha Rivers
Inspect evidence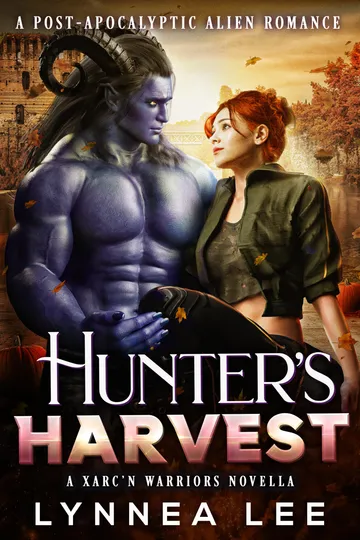 Amazon Bestsellers
Hunter's Harvest: A Post Apocalyptic Alien Romance (Xarc'n Warriors)
Lynnea Lee
Inspect evidence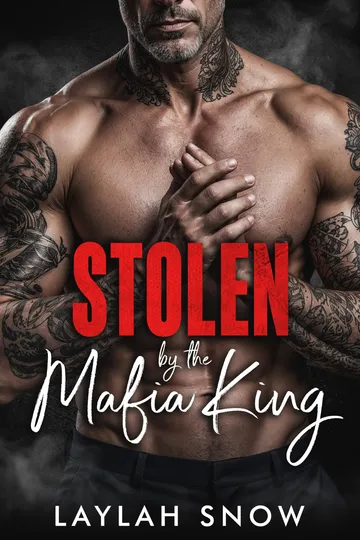 Amazon Bestsellers
Stolen by the Mafia King: An Age Gap, Mafia Romance (Forbidden Kings)
Laylah Snow
Inspect evidence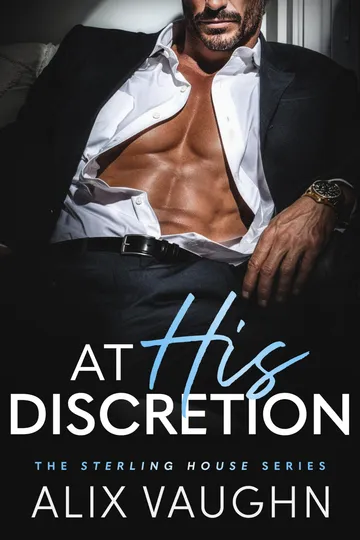 Amazon Bestsellers
At His Discretion: A Billionaire Boss Romance (Sterling House)
Alix Vaughn
Inspect evidence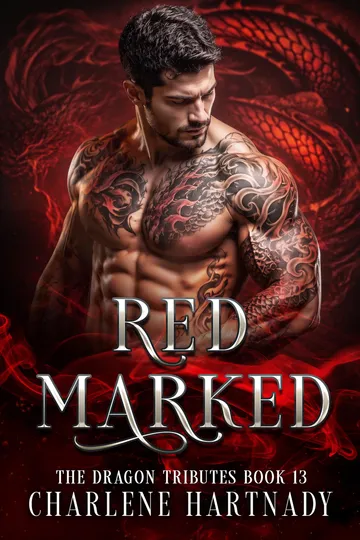 Amazon Bestsellers
Red Marked (The Dragon Tributes Book 13)
Charlene Hartnady
Inspect evidence Amazon Bestsellers
Bought by the Masked Cantor
Cara Wylde
Inspect evidence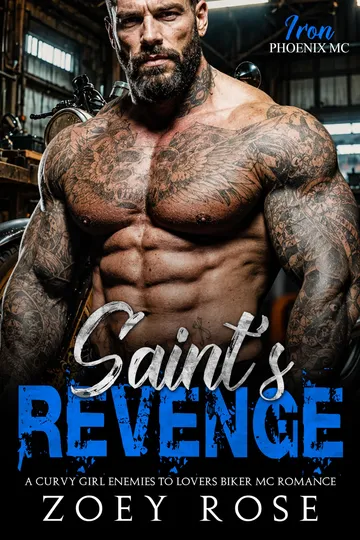 Amazon Bestsellers
Saint's Revenge: A Curvy Girl Enemies to Lovers Biker MC Romance (Iron Phoenix MC Book 9)
Zoey Rose
Inspect evidence Amazon Bestsellers
The Duke's Runaway Lady: A Historical Regency Romance Novel (Runaway Brides Book 1)
Julia Thorne
Inspect evidence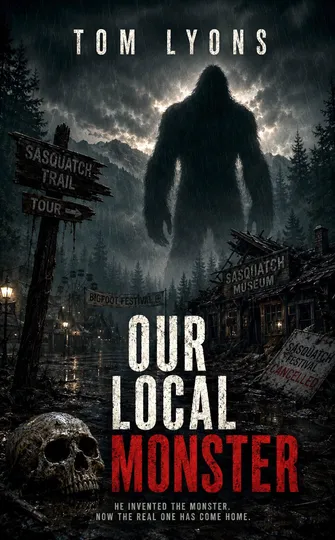 Amazon Bestsellers
Our Local Monster: A Bigfoot Horror Thriller
Tom Lyons
Inspect evidence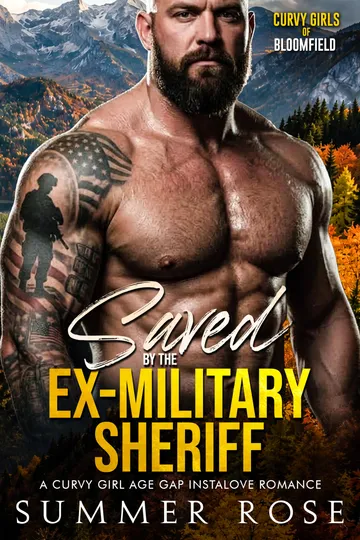 Amazon Bestsellers
Saved by the Ex-Military Sheriff: A Curvy Girl Age Gap Instalove Romance (Curvy Girls of Bloomfield Book 1)
Summer Rose
Inspect evidence Amazon New Releases
Laird of Ash: A Scottish Medieval Historical Romance (Highland Protectors Book 4)
Maddie MacKenna
Inspect evidence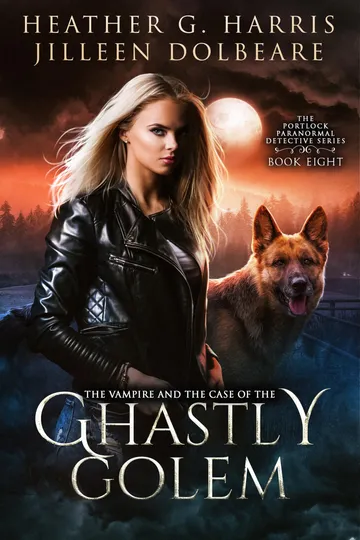 Amazon Bestsellers
The Vampire and the Case of the Ghastly Golem: An Urban Fantasy Novel (The Portlock Paranormal Detective Series Book 8)
Heather G. Harris
Inspect evidence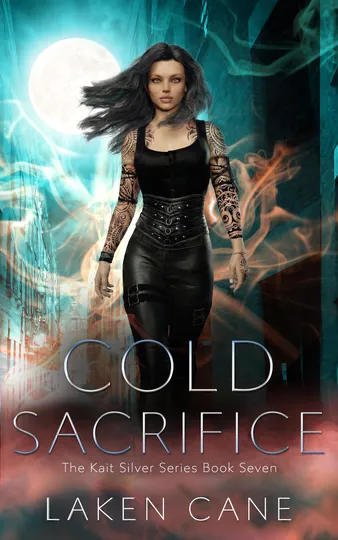 Amazon Bestsellers
Cold Sacrifice (Kait Silver Book 7)
Laken Cane
Inspect evidence Amazon New Releases
The Duke’s Last Chance Bride: A Historical Regency Romance Novel (The Seasons of Ashbourne Book 3)
Hanna Hamilton
Inspect evidence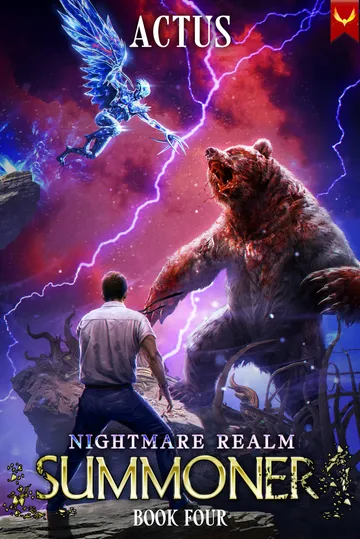 Amazon Bestsellers
Nightmare Realm Summoner 4: A LitRPG Adventure
Actus
Inspect evidence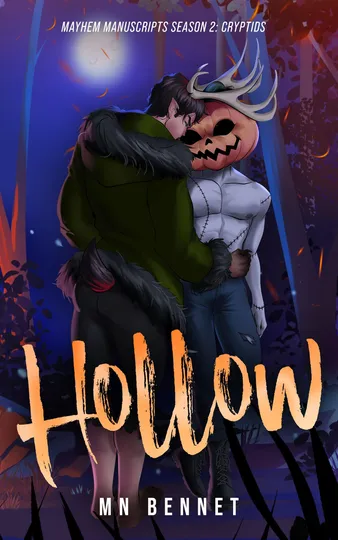 Amazon New Releases
Hollow
MN Bennet
Inspect evidence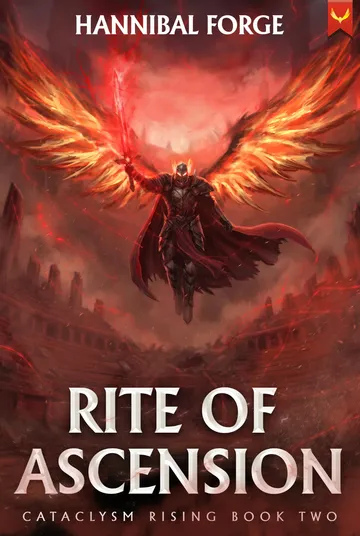 Amazon Bestsellers
Rite of Ascension: An OP MC Isekai LitRPG (Cataclysm Rising Book 2)
Hannibal Forge
Inspect evidence Amazon New Releases
A Bride and a Child for the Beastly Duke: A Historical Regency Romance Novel (Dukes of Surrender Book 5)
Daphne Byrne
Inspect evidence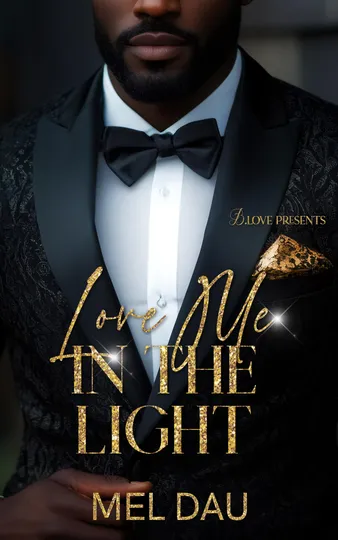 Amazon Bestsellers
Love Me in the Light
Mel Dau
Inspect evidence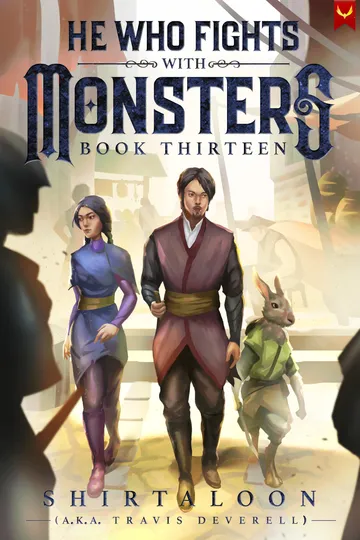 Amazon Bestsellers
He Who Fights with Monsters 13: A LitRPG Adventure
Shirtaloon
Inspect evidence Amazon New Releases
Spicy Romance Brother Best Friend, Sexy Mountain Man Smut: Steamy Age-Gap, Older Grump & Plus Size Woman High-Heat Book (Forbidden & Explicit Quick-Reads 1)
Kzi Younger
Inspect evidence Amazon Bestsellers
A Hometown Kind of Love: A first-love, second-chance hometown romance about the country music star who left, the football coach who stayed, and the ... ... Collection | Falling for Flannel Book 2)
Janine Rosche
Inspect evidence Amazon Bestsellers
Jealous Jinxes (A Luna Thorn Witchy Mystery Book 8)
Amanda M. Lee
Inspect evidence Amazon Bestsellers
Sisters Take All: A Novel (The Finch Sisters Book 3)
Amelia Diane Coombs
Inspect evidence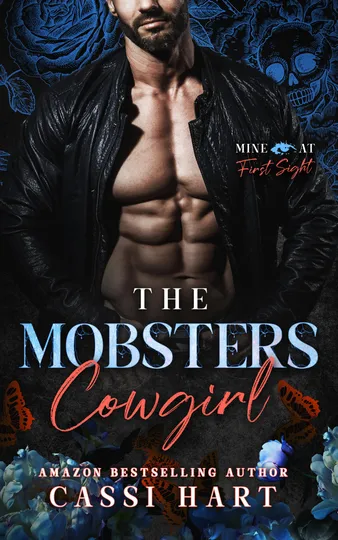 Amazon Bestsellers
The Mobster's Cowgirl
Cassi Hart
Inspect evidence Amazon Bestsellers
Vasmora (The Eating Woods)
Keri Lake
Inspect evidence Amazon Bestsellers
The Last Goodbye (Blue Sky Bay Series Book 2)
Laura Pavlov
Inspect evidence Amazon Bestsellers
Retribution in Paradise (Florida Keys Mystery Series Book 38)
Deborah Brown
Inspect evidence Amazon New Releases
The Things We Swore We'd Never Do
Jillian Dodd
Inspect evidence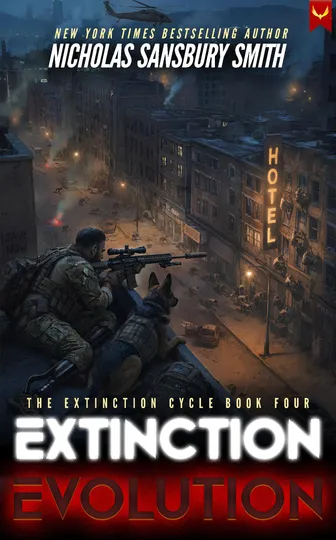 Amazon Bestsellers
Extinction Evolution (Extinction Cycle Book 4)
Nicholas Sansbury Smith
Inspect evidence Amazon Bestsellers
Can't Touch Me
Jackie May
Inspect evidence Amazon Bestsellers
Wicker
Ursula Wills
Inspect evidence Amazon Bestsellers
Path of Steel: A LitRPG Apocalypse
Valerios
Inspect evidence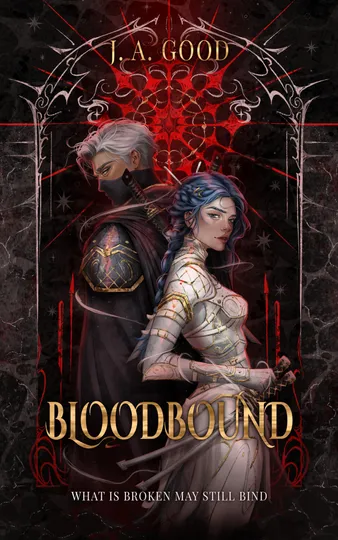 Amazon New Releases
Bloodbound (The Scrolls of the Eshani Book 1)
J.A Good
Inspect evidence Traditional Publishers
Not Home Alone: A spicy, forced proximity, enemies to lovers romance
Kayley Loring
Inspect evidence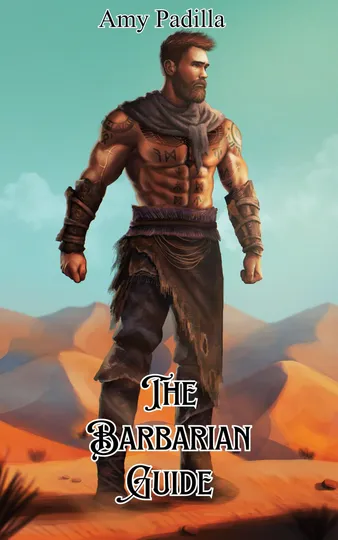 Amazon Bestsellers
The Barbarian Guide (Savagely Sweet Barbarians Book 5)
Amy Padilla
Inspect evidence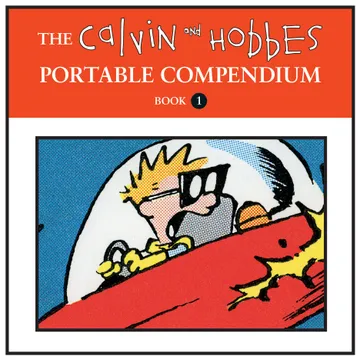 Amazon New Releases
The Calvin and Hobbes Portable Compendium Book 1 (Calvin and Hobbes Compendium Ebooks)
Bill Watterson
Inspect evidence Amazon Bestsellers
To Educate an Earl (Dollar Princess Series Book 3)
Gabrielle Meyer
Inspect evidence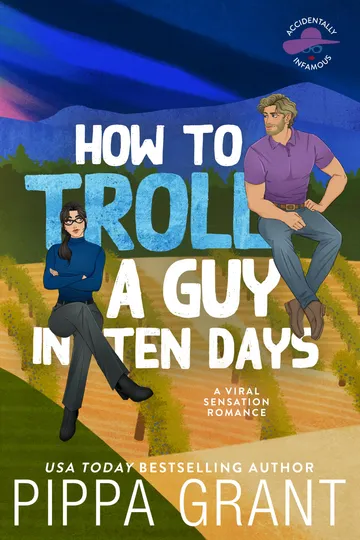 Amazon Bestsellers
How to Troll a Guy in Ten Days: A Viral Sensation Romance (Accidentally Infamous Book 3)
Pippa Grant
Inspect evidence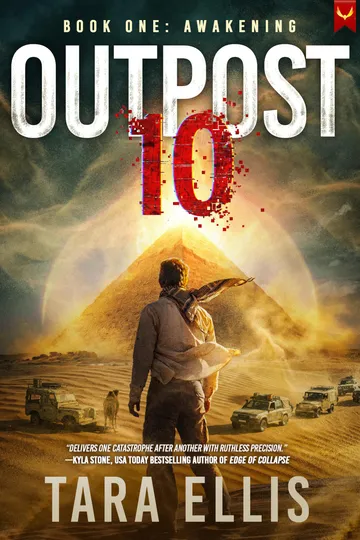 Amazon Bestsellers
Outpost 10: Awakening: A Post-Apocalyptic Survival Thriller
Tara Ellis
Inspect evidence Amazon Bestsellers
Savage Heart (Harrington Ranch)
Willow Aster
Inspect evidence Amazon Bestsellers
Wild Silver and Lead: A Dark Military Romance (Snake Ops Book 1)
Lexie Axelson
Inspect evidence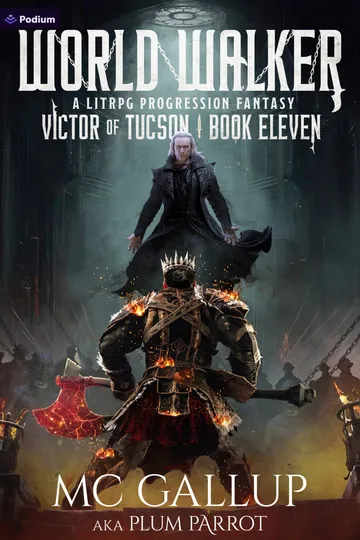 Amazon Bestsellers
World Walker: A LitRPG Progression Fantasy (Victor of Tucson Book 11)
Plum Parrot
Inspect evidence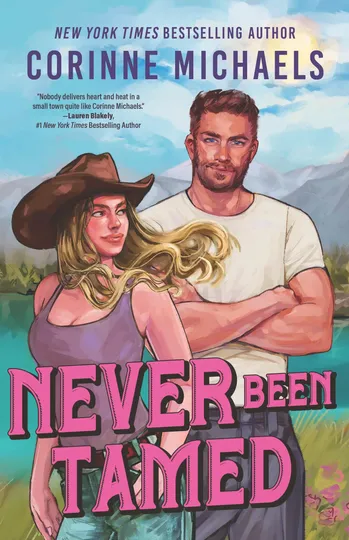 Amazon Bestsellers
Never Been Tamed (Heartstone Ranch Book 2)
Corinne Michaels
Inspect evidence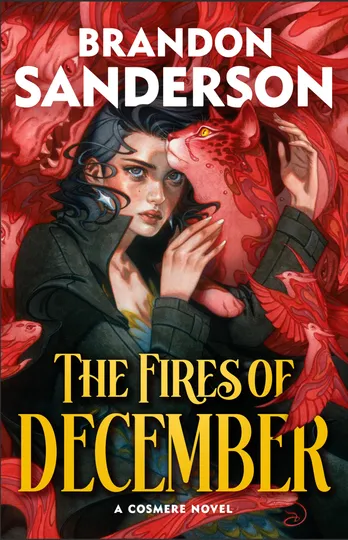 Amazon Bestsellers
The Fires of December (Hoid's Travails)
Brandon Sanderson
Inspect evidence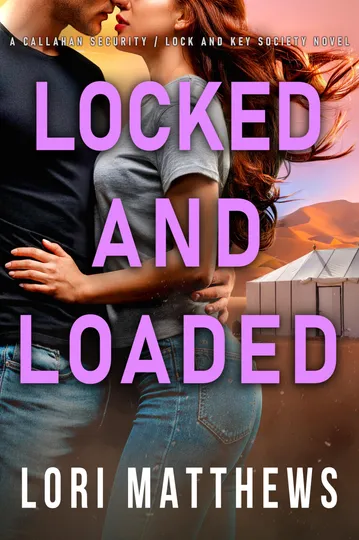 Amazon Bestsellers
Locked and Loaded: A Heart-Pounding, Steamy, Romantic Thriller (Callahan Security Series Book 9)
Lori Matthews
Inspect evidence Amazon New Releases
The Mrs. Astor: A Gilded Age Novel of Caroline Schermerhorn Astor
Deanna Lynn Sletten
Inspect evidence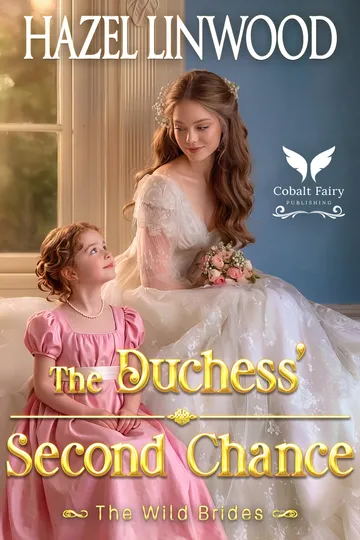 Amazon New Releases
The Duchess’ Second Chance: A Historical Regency Romance Novel (The Wild Brides Book 13)
Hazel Linwood
Inspect evidence Amazon Bestsellers
Their Final Score: Untouched Vol 6 of 6
C.S. Berry
Inspect evidence Amazon Bestsellers
Boss Me Dirty: An Age Gap Workplace Romance (The King Brothers)
Kai Lesy
Inspect evidence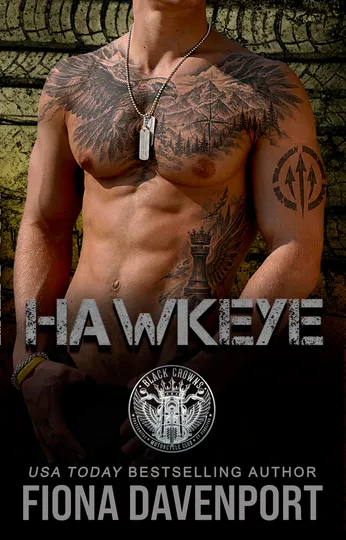 Amazon Bestsellers
Hawkeye (Black Crowns MC Book 4)
Fiona Davenport
Inspect evidence Amazon Bestsellers
My Hood Crush Got Me Pregnant: An Unhinged Romance
Mz. Biggs
Inspect evidence Amazon Bestsellers
The Wrong Monster: An Age Gap Bratva Romance (Mafia Silver Foxes)
Sierra Voss
Inspect evidence Amazon Bestsellers
Run Mad: A Pride and Prejudice Variation (Happily Ever After with Mr Darcy Series)
Amy D'Orazio
Inspect evidence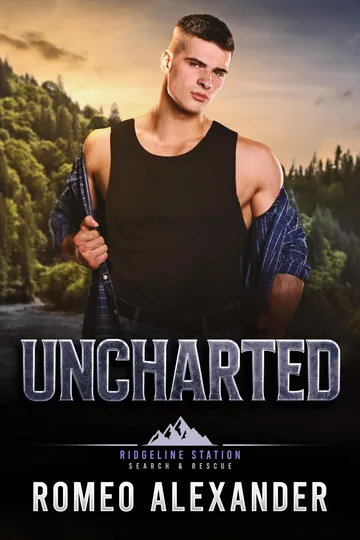 Amazon Bestsellers
Uncharted (Ridgeline Station)
Romeo Alexander
Inspect evidence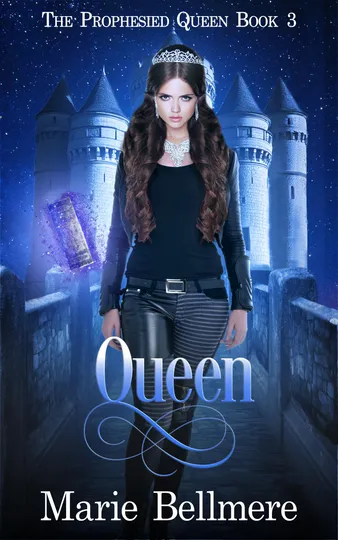 Amazon New Releases
Queen: An Enchanted Races Trilogy (The Prophesied Queen Book 3)
Marie Bellmere
Inspect evidence Amazon Bestsellers
The Husband I Left
Katie Ivey
Inspect evidence Amazon Bestsellers
My Boyfriend Forgot to Mention he's a Wolf Shifter
Roxie Ray
Inspect evidence Amazon Bestsellers
The Thaw: A Post Apocalyptic Survival Thriller
Brad Knight
Inspect evidence Amazon New Releases
I’m a Conqueror: A Military Space Opera of War, Rebellion, and Conquest (I, Warship Book 3)
Sean Robins
Inspect evidence Amazon Bestsellers
Private Lessons (Mind, Body, & Soul)
Netra Antionette
Inspect evidence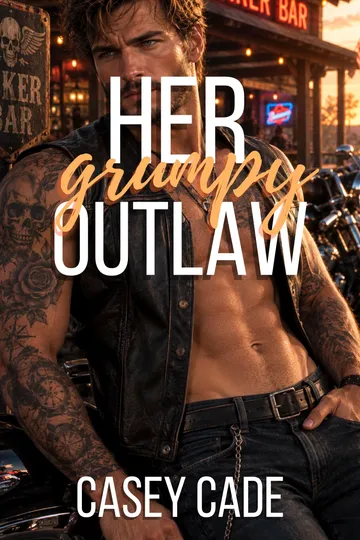 Amazon Bestsellers
Her Grumpy Outlaw
Casey Cade
Inspect evidence Amazon Bestsellers
Ignored by Her Billionaire Husband: A Billionaire Marriage-in-Crisis Romance (The Unseen Wives Book 9)
Riley King
Inspect evidence Amazon Bestsellers
Dark Mage: A Returner OP MC LitRPG Adventure: The Nine Circles Book 2
Vexis
Inspect evidence Amazon Bestsellers
Shared With The Pack: A Spicy MMM/M Shifter Romance
J.J. Jude
Inspect evidence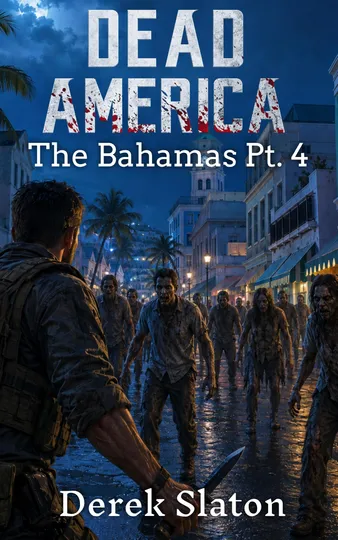 Amazon Bestsellers
Dead America - The Bahamas - Part 4 (Dead America - Tales of the First Month Book 61)
Derek Slaton
Inspect evidence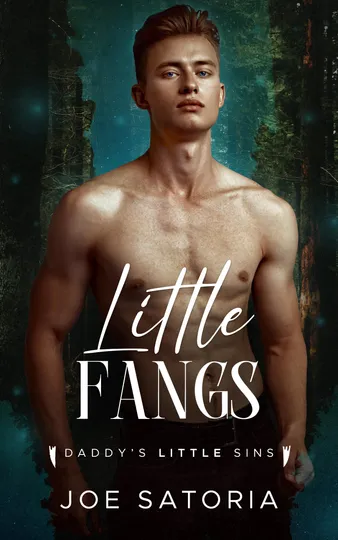 Amazon New Releases
Little Fangs
Joe Satoria
Inspect evidence Amazon Bestsellers
The Right Kind of Wrong
Monica McCallan
Inspect evidence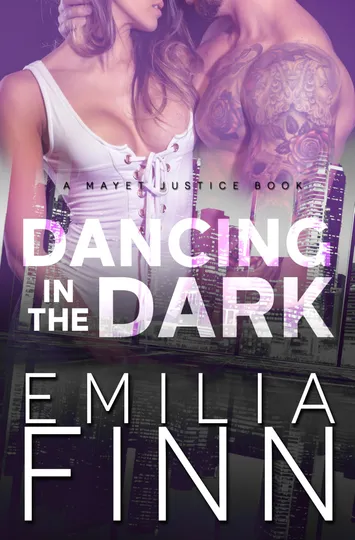 Amazon Bestsellers
Dancing In The Dark (A Mayet Justice Book Book 22)
Emilia Finn
Inspect evidence Traditional Publishers
Christmas with the East End Girls: Completely unputdownable, heart-warming and festive World War Two saga fiction
Jean Fullerton
Inspect evidence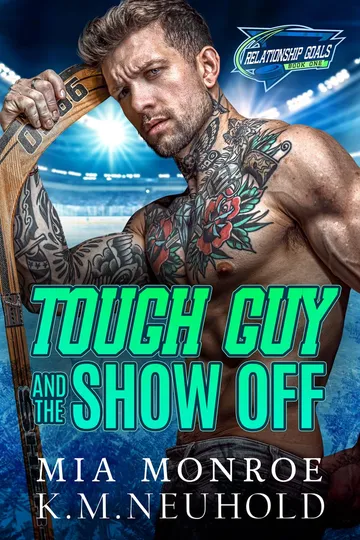 Amazon Bestsellers
Tough Guy and the Show Off: An MM Hockey Romance (Relationship Goals Book 1)
Mia Monroe
Inspect evidence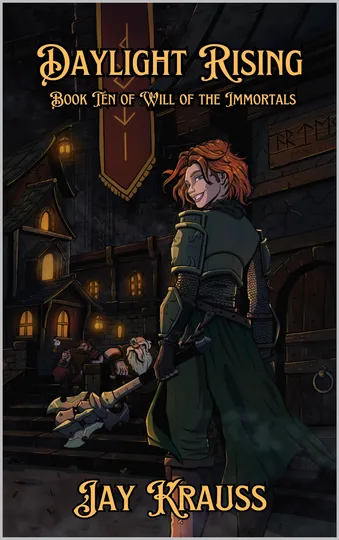 Amazon Bestsellers
Daylight Rising (Will of the Immortals Book 10)
Jay Krauss
Inspect evidence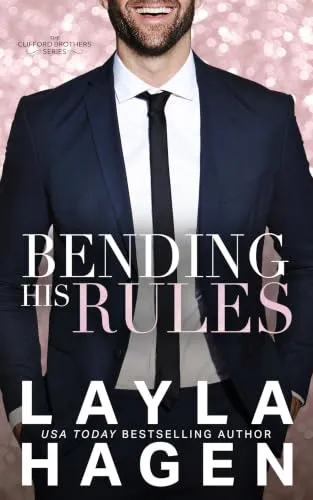 Amazon Bestsellers
Bending His Rules: A Single Dad Romance (The Clifford Brothers)
Layla Hagen
Inspect evidence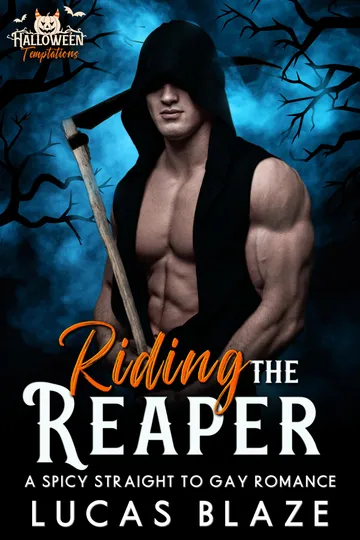 Amazon Bestsellers
Riding the Reaper: A Spicy Straight to Gay Romance
Lucas Blaze
Inspect evidence Amazon Bestsellers
Baby for the Bratva King: An Age Gap, Billionaire Boss Romance (Ruthless Mafia Daddies)
Bella Page
Inspect evidence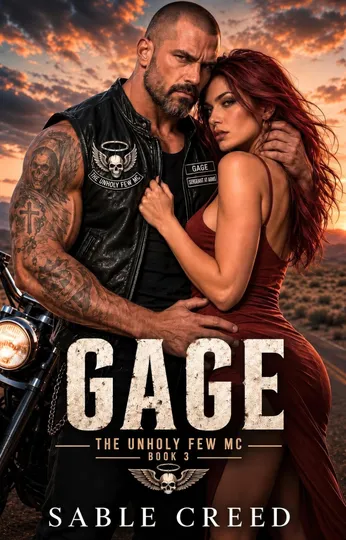 Amazon Bestsellers
Gage (The Unholy Few MC Book 3)
Sable Creed
Inspect evidence Amazon Bestsellers
THE NOAH PROJECT: BOOK 2 (In The As The Light Dies World)
Sharon Thorne
Inspect evidence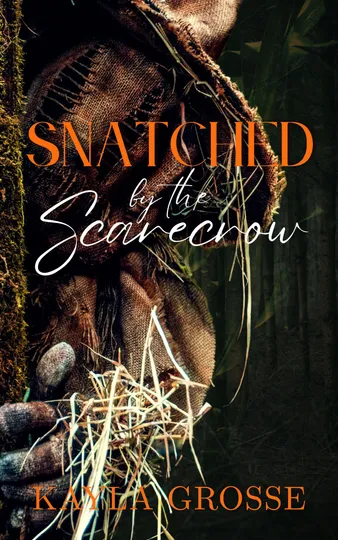 Amazon Bestsellers
Snatched by the Scarecrow (Holiday Hookups Book 3)
Kayla Grosse
Inspect evidence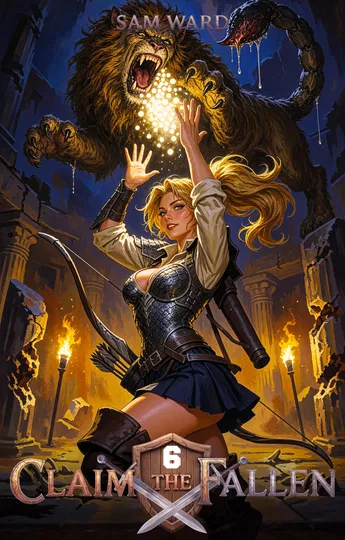 Amazon Bestsellers
Claim The Fallen 6: Twelve Crests Deep
SAM WARD
Inspect evidence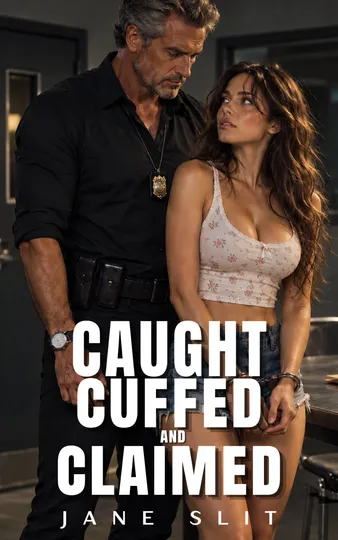 Amazon Bestsellers
Caught, Cuffed, and Claimed: A High-Stakes Taboo Erotica Short of Punishment and Desire (Too Close To Resist)
Jane Slit
Inspect evidence Traditional Publishers
The Last Train from Paris: An absolutely heartbreaking and unputdownable WW2 novel (The Paris Sisters Book 5)
Suzanne Kelman
Inspect evidence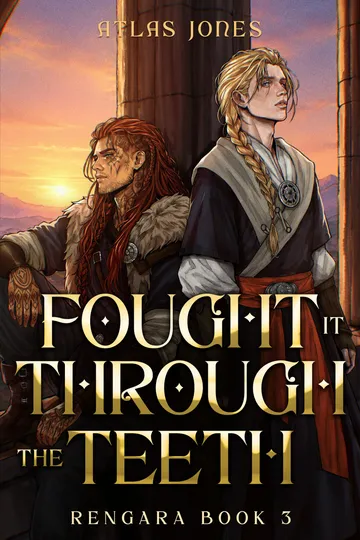 Amazon Bestsellers
Fought it Through the Teeth (Rengara Book 3)
Atlas Jones
Inspect evidence Amazon Bestsellers
Best Friends that Fck 2: A Friends to Lovers Twisted Romance (Best Friends that Fck: A Friends to Lovers Twisted Romance)
Krystal Armstead
Inspect evidence Amazon Bestsellers
Grimdark Magazine Issue #48
Ken Liu
Inspect evidence Amazon Bestsellers
The Ferryman's Daughter (Bloodlines Book 1)
Yasmin Angoe
Inspect evidence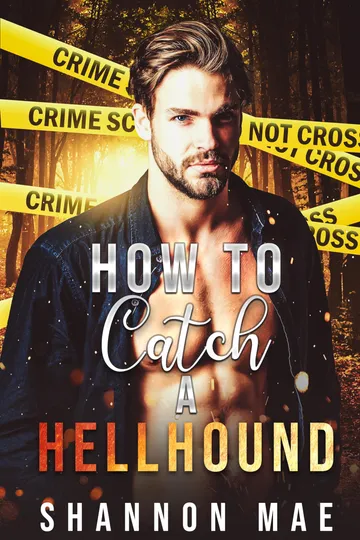 Amazon Bestsellers
How to Catch a Hellhound (Hellhounds of Paradise Falls Book 6)
Shannon Mae
Inspect evidence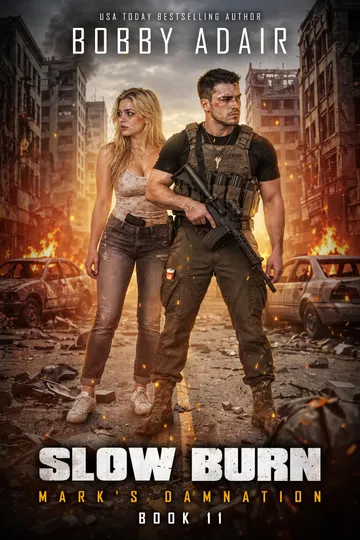 Amazon Bestsellers
Slow Burn: Book 11: Mark's Damnation
Bobby Adair
Inspect evidence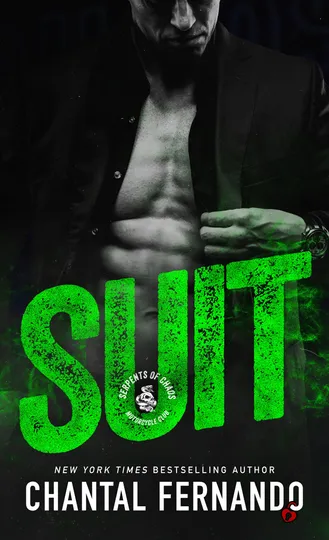 Amazon Bestsellers
Suit: An Arranged Marriage Spicy Mafia MC Biker Romance (Serpents of Chaos MC Book 7)
Chantal Fernando
Inspect evidence Amazon Bestsellers
WEREWOLF IN TEXAS 2: 150 Years Ago. A Horror Novel
Allison Woods
Inspect evidence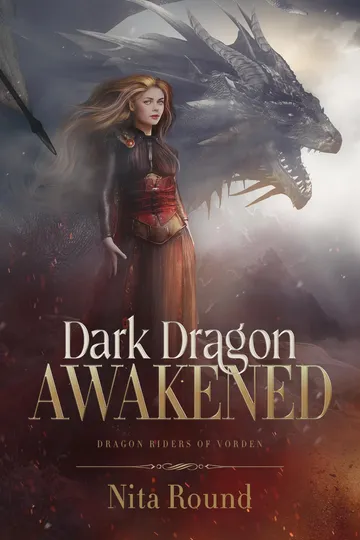 Amazon New Releases
Dark Dragon Awakened: Dragon Riders of Vorden
Nita Round
Inspect evidence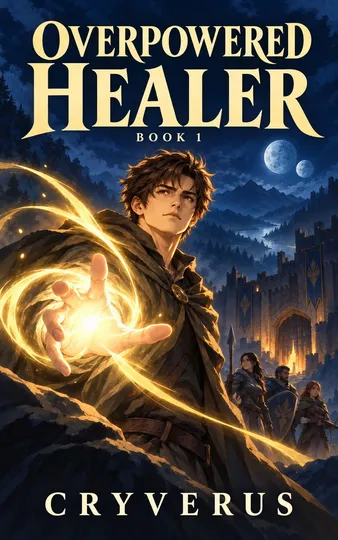 Amazon Bestsellers
Overpowered Healer Book 1: An Isekai LitRPG
CRYVERUS
Inspect evidence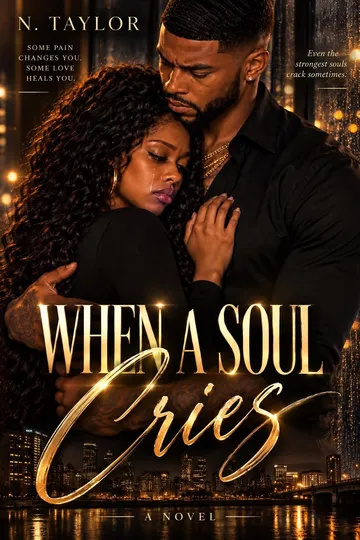 Amazon Bestsellers
When a Soul Cries
N. Taylor
Inspect evidence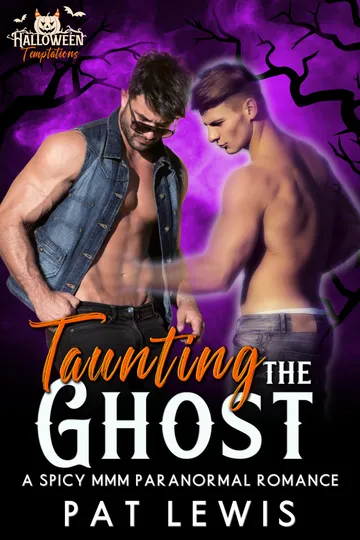 Amazon Bestsellers
Taunting the Ghost: A Spicy MMM Paranormal Romance
Pat Lewis
Inspect evidence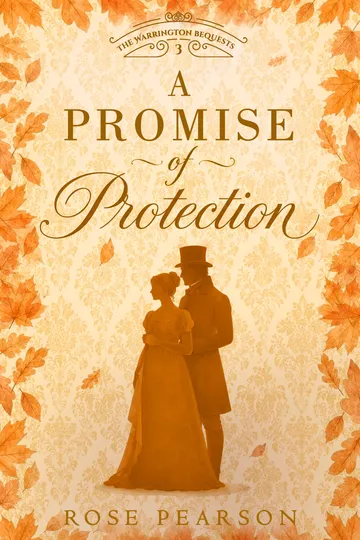 Amazon New Releases
A Promise of Protection: A Regency Romance (The Warrington Bequests Book 3)
Rose Pearson
Inspect evidence Amazon Bestsellers
The One-Night Secret: A Best Friend's Brother Small Town Romance (Steele Brothers of Starlight Cove Book 5)
Brighton Walsh
Inspect evidence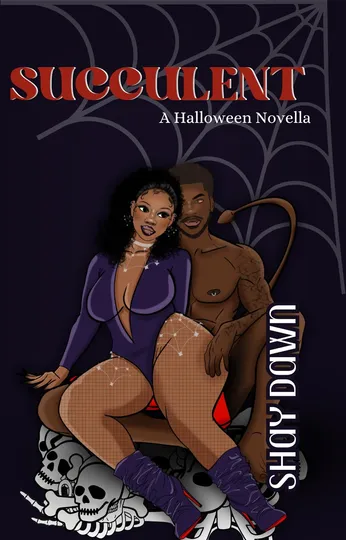 Amazon Bestsellers
Succulent
Shay Dawn
Inspect evidence04 / Evidence interpretation
What It May Mean.
Built Oct 31, 2026
AI interpretationgpt-6-luna
exploratory confidenceFigure covers appeared in 43.3% of the current sample, up 5.3 percentage points from the previous period’s 38%.
Within the supplied 30-day all-market data, prevalence was 45.2% in Amazon Bestsellers (177/392), 42.4% in Amazon New Releases (104/245), and 25.8% among Traditional Publishers (8/31). No Indie Author sample was available.
Compare current and previous covers side by side, coding figure prominence, number of figures, pose, and framing by source to see which visual patterns account for the observed difference.
Facts supplied to the interpreter
Current: 289 of 668 covers (43.3%).
Previous: 194 of 511 covers (38.0%).
Reported change: +5.3 percentage points.
The source breakdown varies, and the Traditional Publisher sample is small (31).